#PROGRESS TRACKING
Dashboards in Plaky keep work visible, letting you track progress and pinpoint bottlenecks across different boards at the same time.
Unlimited users ● Free forever ● No credit card
Get started
Know where your most important work stands. Get a bird’s-eye overview of your key initiatives in one single macro summary.
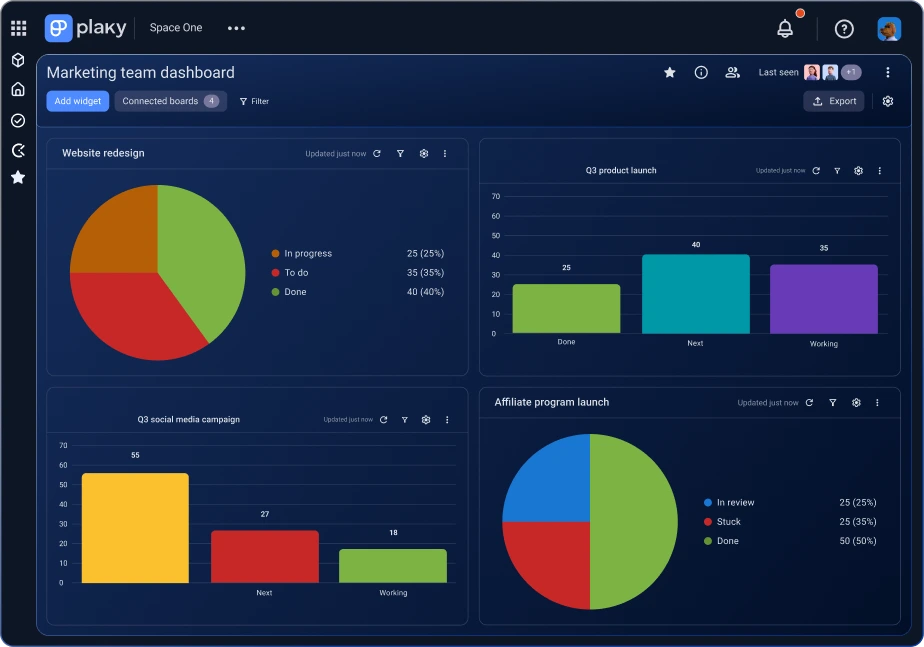
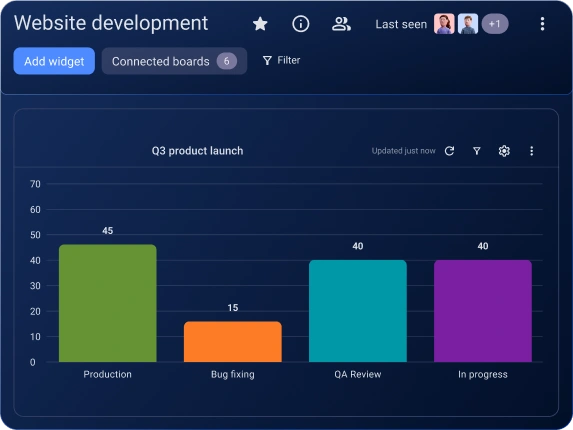
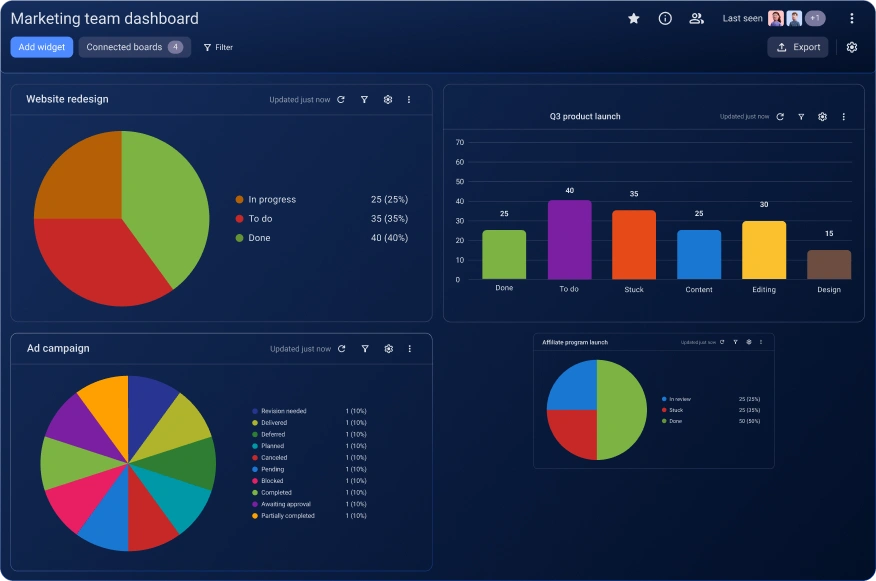
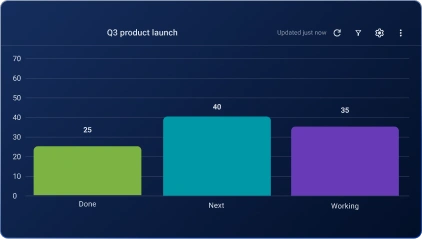
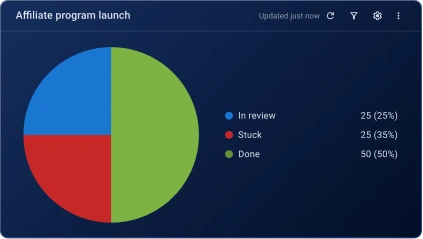
Connect and track progress on multiple boards at once. Display key project data in pie or bar chart widgets — automatically refreshed every 15 minutes.
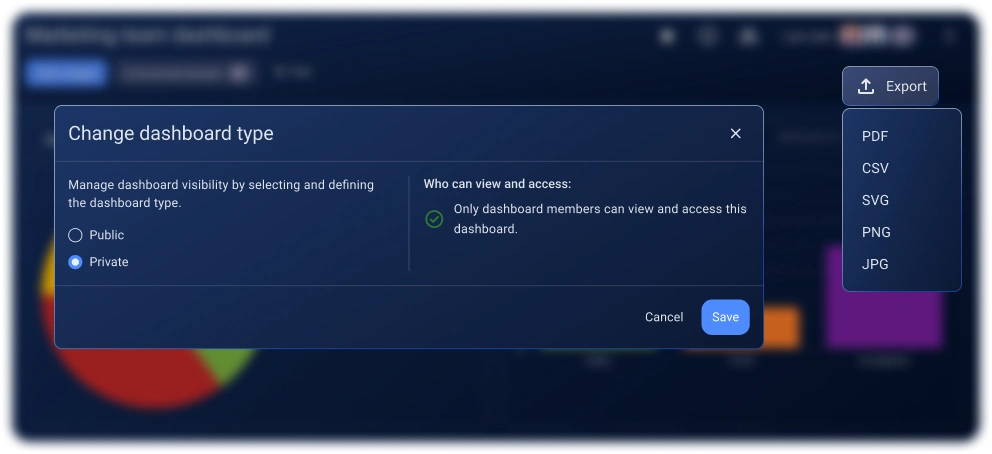
Customize your dashboards and export them for easy stakeholder reporting. Create private dashboards for a handful of members to keep sensitive information secure.
Compare the highs and lows of your projects to identify trends at a glance.
Visualize how parts of your project are distributed and gain insights about project health.
Click on the + sign under the Space name and select New dashboard. When prompted, name your dashboard and, if you want, make it private to ensure only you and added members have access to it.
Check off all the boards you want to include in the dashboard.
Click on Add widget and choose whether you want to add a pie or a bar chart.
Click on the gear icon in a particular widget to open Settings. Once there, select the data sources (boards you want to pull data from) for that particular widget.
Keep in mind that Plaky will try to automatically map board fields once you connect the boards. Users can also manually override default mapping in Dashboard settings to refine data visualization.
Change data grouping and sorting, and customize data label colors according to your needs. Also, decide if you want to include Subitems in the widget data.
Dashboards in Plaky are centralized visual tools that let users pull data from different boards into a summary overview for easier progress tracking and analysis.
Dashboards are available on all Plaky plans: FREE (connect 1 board per dashboard), PRO (connect 15 boards per dashboard), and ENTERPRISE (connect 30 boards per dashboard).
Creating new dashboards is super intuitive — just click on the + sign in the left sidebar, select New dashboard, and follow the prompts.
For now, you can add only bar and pie chart widgets. More chart types will be available soon.
Yes, by clicking the gear icon, you can access the Settings panel of each widget, where you can customize it further: change data grouping, select new label colors, and more. You can also resize, as well as drag and drop the widgets across the dashboard.
Yes, you can export your dashboards manually in PDF, PNG, and ZIP formats. Additionally, you can export individual chart widgets as PDF, SVG, PNG, and JPG.
Your dashboards can be public and accessible to everyone. Alternatively, you can make them private and give access to only a select group of team members.