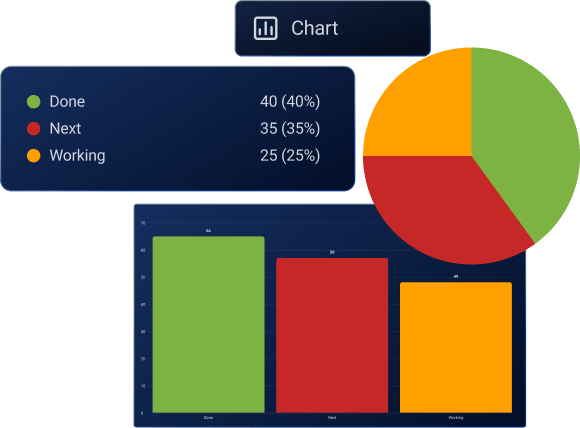
Instant visual insights
Plaky’s powerful Chart View revolutionizes how you see your work. Projects are easily transformed into clear Pie and Bar charts, that instantly give you an idea of where you stand with your tasks.
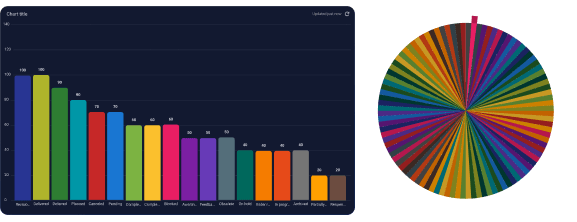
Data accuracy
The Chart View is your reliable tool for deep data analysis. Easily visualize team performance, task completion, how your projects are progressing, and many other insights.
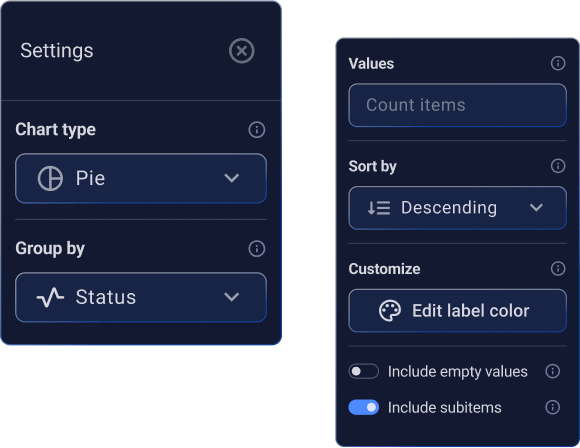
Flexible and customizable charts
Customize your charts to see exactly what you need. From the Settings panel, easily switch chart types, group data by different fields, sort values, apply filters, and even include subitems to tailor your view for clear insights.
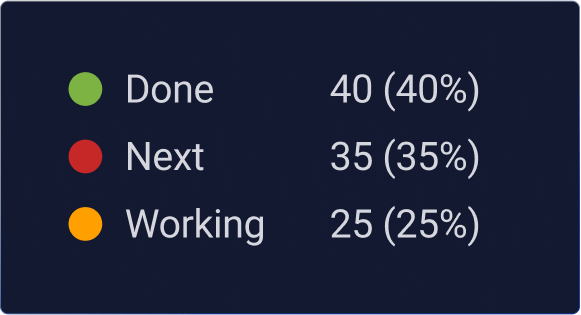
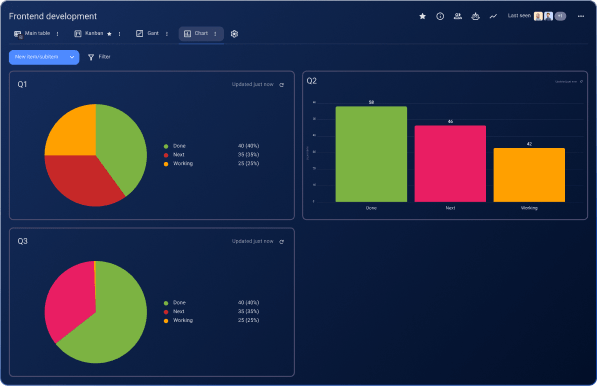
Synchronized visibility
Add multiple pie or bar charts as widgets to get a high-level overview of progress, from all angles. Compare past and current metrics and manage data reporting from a single board view.
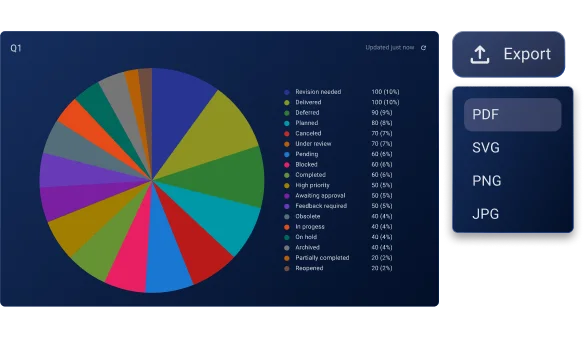
Easy sharing
Export your charts in various formats and share them outside your Plaky workspace. Keep reporting seamless and ensure external stakeholders are informed about your progress.