 Updated: December 4, 2024
 Schedule variance measures one of the most important elements of a project — time. The amount of time designated to certain tasks and milestones is an important benchmark for managers and stakeholders.
To prevent a project from missing its deadlines, you can use schedule variance during project development to catch any activities behind schedule and avoid a domino effect.
Learn how to calculate schedule variance through formulas and examples.
- Schedule variance is a project management metric that helps managers assess if the project is developing as planned.
- Earned value management (EVM) includes schedule variance analysis as one of the most important metrics.
- Negative schedule variance indicates that the project is ahead of schedule.
- Factors beyond the project manager’s control can impact the activity timeline.
What is schedule variance?
Schedule variance is a project metric that measures the difference between the planned amount of work and the actually performed work up to a certain point in time.
Calculating SV also tells you:
- How to measure the work you’ve finished,
- How far behind schedule you are, and
- How much more work needs to be completed to catch up.
Schedule variance is a useful project KPI because it shows you whether you are on schedule and how to adjust your work accordingly.
The best way to set up a project and its schedule includes the following steps:
- Create a work breakdown structure,
- Define the project baseline, and
- Establish the project scope.
Once these elements have been clearly defined, you’ll be able to follow the project’s progress and compare it to the planned values.
Analyzing schedule variance along the way may prompt project managers to take preventive action and make changes to any of these project components.
💡 Plaky Pro Tip
Here’s a blog post to help you learn how to better keep track of the time you and your team spend on each project:
How to calculate schedule variance
The formula to calculate schedule variance (SV) is:
SV = BCWP – BCWS
Schedule variance is the difference between the budgeted cost of work performed (BCWP) and the budgeted cost of work scheduled (BCWS).
The budgeted cost of work performed is also known as earned value (EV), while the budgeted cost of work scheduled is synonymous with planned value (PV).
So, the formula for schedule variance (SV) can also be expressed like this:
SV = EV – PV
This version of the calculation shows schedule variance as the difference between earned value and planned value. Both formulas show that schedule variance is the deviation of the completed work from the expected amount of work.
Here’s what the result tells us about the project’s performance:
- SV < 0 — the project is behind schedule.
- SV = 0 — the project is exactly on schedule.
- SV > 0 — the project is ahead of schedule.
You can also calculate the schedule variance percentage with the following formula:
SV% = SV / BCWS x 100
Similarly to the previous formula, the result tells us whether the project is on schedule or not:
- SV% < 0 — the project is behind schedule.
- SV% = 0 — the project is exactly on schedule.
- SV% > 0 — the project is ahead of schedule.
💡 Plaky Pro Tip
Schedule variance is a big part of earned value management, a performance management technique. If you want to learn more about EVM, check out our guide:
Schedule variance examples
Based on those 3 results, project managers may have to deal with 3 different project scenarios involving:
- Negative schedule variance,
- Zero schedule variance, and
- Positive schedule variance.
Let’s see an example for each to better understand the implications of schedule variance in real life.
Negative schedule variance
Let’s say you’re planning a nonprofit event.
Your total budget is $250,000, and so far, your team was supposed to complete $140,000 worth of work. Recent reports show that they’ve completed 50% of the total project work.
First, you need to turn the percentage of the completed work into a monetary value:
BCWP = EV = (% of actual work completed) * BAC = 50% * $250,000
BCWP = EV = $125,000
The result shows that your team hasn’t completed the amount of work you were expecting for the given time period.
Now that you know the BCWP, you can easily calculate schedule variance:
SV = BCWP – BCWS = $125,000 – $140,000 = -$15,000
This means you are $15,000 behind schedule.
Using the other formula, you can calculate the schedule variance percentage:
SV% = SV / BCWS x 100 = -$15,000 / $140,000 x 100 = -10.7%
This result tells you that you’d have to complete around an extra tenth of the work going forward to stay on schedule.
💡 Plaky Pro Tip
There’s another project KPI closely related to schedule variance — the schedule performance index. If you want a more detailed rundown of SPI, check out this article:
Zero schedule variance
Now, imagine you’re planning a corporate event.
While the total budget is $30,000, you’ve already spent $24,000. You want to check how the project is progressing, as you expected to complete 80% of the work so far.
Using these metrics, you can determine the budgeted cost of work scheduled:
BCWS = (% of expected completed work) * BAC = 80% * $30,000 = $24,000
You can already see that the performed work equals what was scheduled:
SV = BCWP – BCWS = $24,000 – $24,000 = $0
Since SV is 0, SV% is also 0. Therefore, you’ve completed exactly the amount of work you expected to complete at this point in the project.
Everything is going as planned — now you just need to make sure it stays that way.
💡 Plaky Pro Tip
You can also calculate whether the project costs have deviated from their planned values. The formula for cost variance (CV) is similar to the one for schedule variance. Read more here:
Positive schedule variance
Finally, let’s suppose you are working on a game development project.
This game is a triple-A release, so your budget is $70 million. 37% of the work has been completed so far, compared to the expected 35%.
Let’s turn these percentages into their monetary values first:
BCWP = 37% * $70,000,000 = $25,900,000
BCWS = 35% * $70,000,000 = $24,500,000
Now, calculate the schedule variance:
SV = $25,900,000 – $24,500,000 = $1,400,000
You are a whopping $1.4 million ahead of schedule! However, you should always view the schedule variance relative to your project budget.
The SV% shows the following:
SV% = SV / BCWS x 100 = $1,400,000 / $24,500,000 x 100 = 5.7%
This means you are actually only 5.7% ahead of schedule. So, while you can give yourself a bit of breathing room, you shouldn’t relax too much.
💡 Plaky Pro Tip
If you want to find out which tools will make your game development project successful, check out this guide:
The benefits of calculating schedule variance
No matter how short or small a project is, it can always fall off the rails and behind schedule. This risk only increases with the project’s value and complexity.
Measuring schedule variance brings valuable benefits to project managers:
- Project performance insight — Calculating the schedule variance gives you direct and accurate insight into the real-time performance of your project. It allows you to adjust your expectations based on whether or not the project is behind schedule.
- Highlighted delay issues — Delays are not always easy to notice until you run the numbers. While SV can only tell you when a delay is already happening, you can prevent it from escalating and keep project deadlines in check. You can stop the cause of the delay as soon as you notice it and calculate how much harder your team has to work to make up for the delay. This allows you to get back on track with your project.
- Improved transparency — Good communication with your project stakeholders and transparency are the pillars of a successful project. Keeping everyone who influences the project updated on its performance can prevent confusion and give a heads-up on time if additional effort is needed.
- Valuable insight for future decisions — SV helps determine if there are issues in your project schedule. By identifying these issues and finding solutions to avoid them in the future, you can actually improve your project management skills.
💡 Plaky Pro Tip
Communication can be very influential to your project’s success or failure, so read up on its importance in this guide:
Causes of negative schedule variance
When the project is behind schedule, we have negative schedule variance.
The causes of delays and failure to reach the planned results at the expected moment vary across companies and industries. Sometimes, factors out of the manager’s control influence the project timeline.
That said, the main causes of negative SV are usually:
- Incorrect planning — Not determining your planned value correctly, undershooting your budget, or failing to determine the right order of operations can all lead to devastating effects on your schedule.
- Work pattern changes — You can predict some forces that influence the state of your schedule, like vacation days or holidays. Situations like sick days, workplace conflicts, or delivery delays are more unpredictable and may halt your team’s workflow.
- Workspace changes — The time it takes for your team to get acquainted with a new workspace will influence your schedule variance. For example, deciding to start using a new communication tool or switching offices can cause negative schedule variance.
- Lack of project resources — Estimating your project resources incorrectly can easily lead to negative SV, as they are essential to the success of any project.
- Lack of communication — Miscommunication can cause project failure. If your team can’t communicate when they are stuck, the issue won’t be fixed, causing delays.
📖 Schedule variance is just one of the most relevant project management concepts. For a better understanding of the general subject of project management, explore our Project Management Glossary of Terms.
Keep projects on track with Plaky
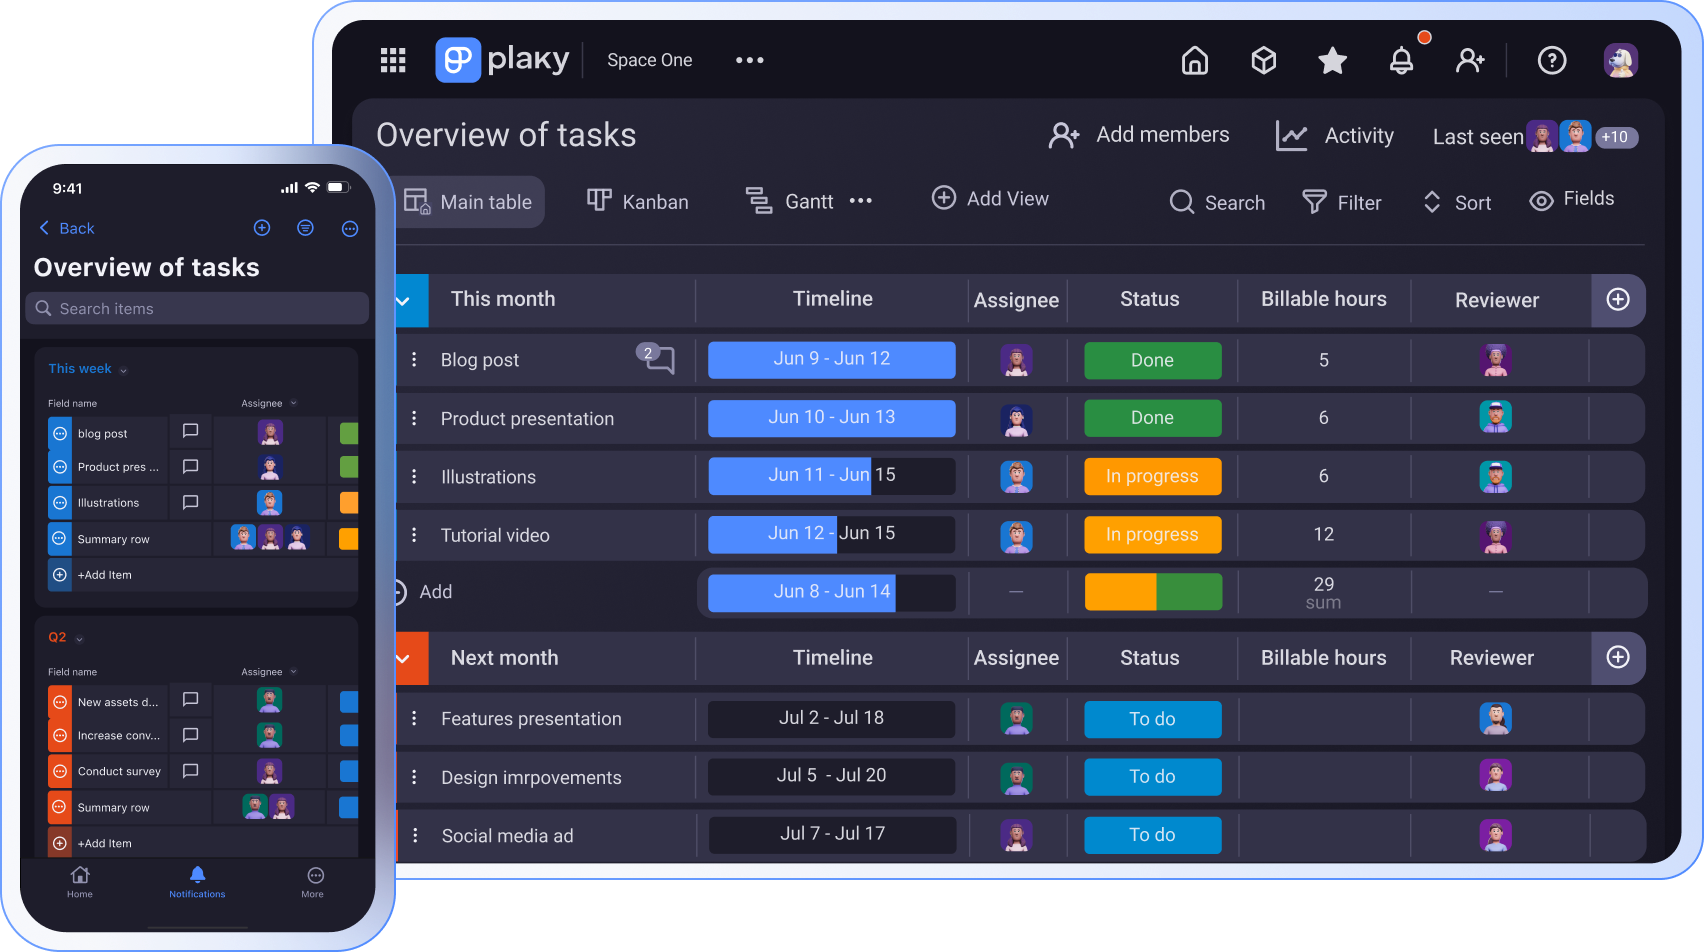
Managing teams and projects can be much easier with a free project management platform like Plaky.
Essentially, Plaky helps keep your entire project on track by letting you:
- Describe every activity in detail while creating items,
- Increase accountability by assigning the right people to the right tasks,
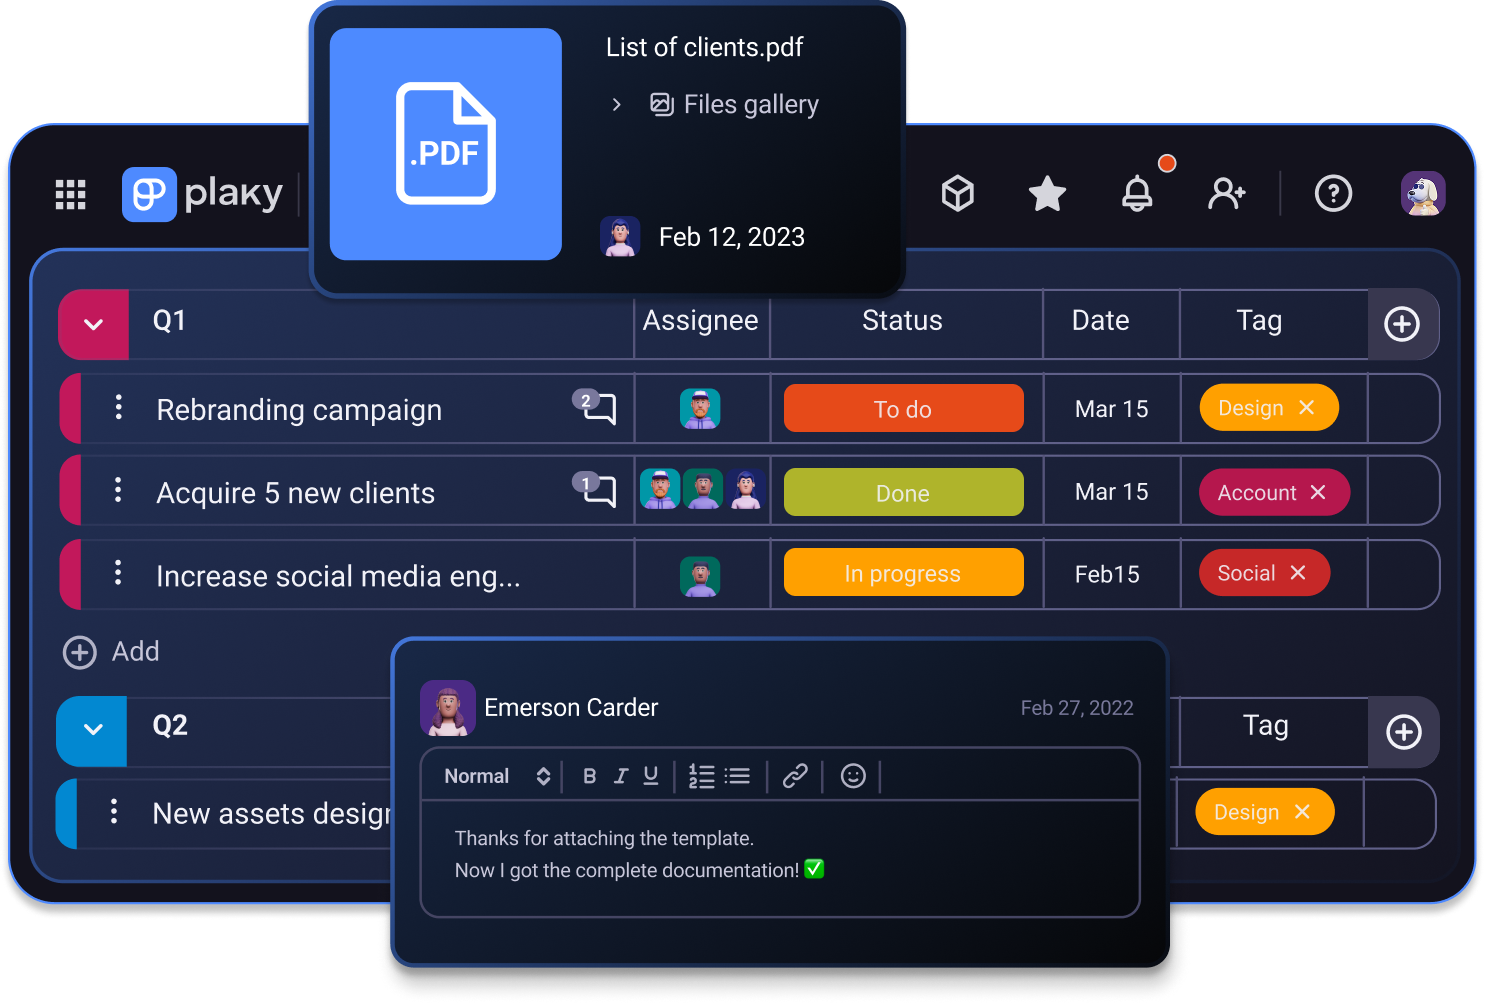
- Nurture transparent collaboration while sharing real-time updates with stakeholders in comments,
- Share information and files to keep everyone in the loop,
- Have a clear overview of your team’s efforts by tracking time spent on tasks, and
- Maintain control over deadlines by setting clear task due dates with custom fields.
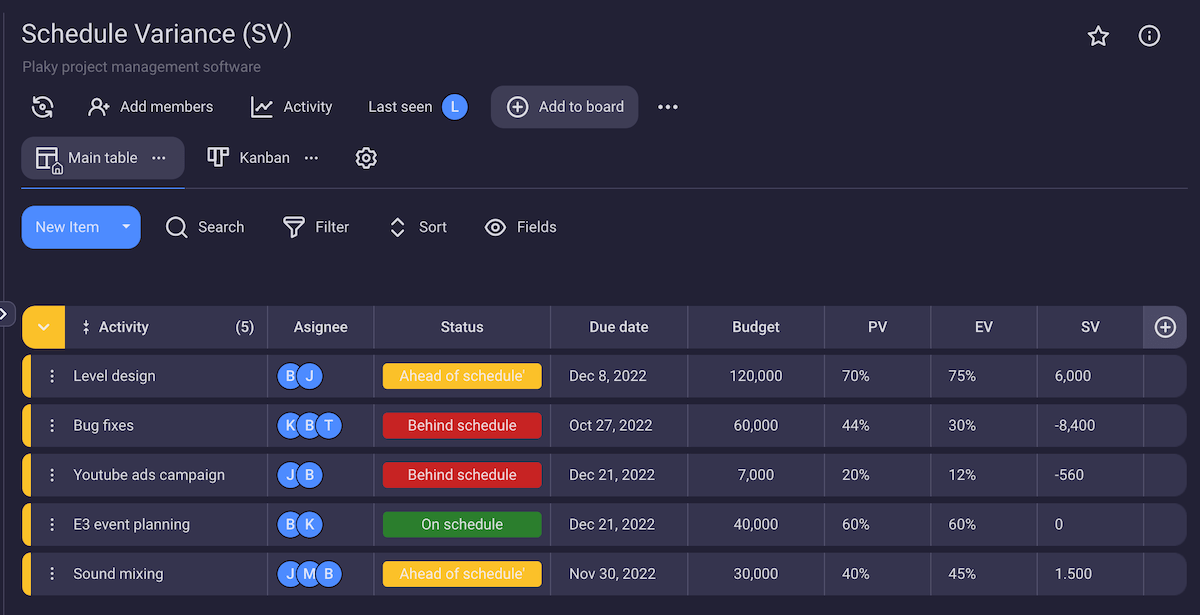
With all the deadlines and costs in front of you, you’ll be able to instantly tell when something’s not right at a single glance. After all — keeping track of your project schedule and reacting on time comes naturally when all the needed information is in one place.
Never miss a deadline again. Start your free Plaky 7-day trial today.
How we reviewed this post: Our writers & editors monitor the posts and update them when new information becomes available, to keep them fresh and relevant.