Updated: September 13, 2024
 Earned value management is a performance management technique that gives you a detailed insight into a project’s current and future performance.
Read on to learn about the most important EVM concepts and formulas and how to implement them in your projects.
- Earned value management is a widely accepted performance management technique used to determine the project’s current and future performance.
- EVM considers project scope, schedule, and cost data to provide an insight into the project’s health and progress.
- Some of the benefits of EVM are reduced project risk, more accurate reporting on the project’s progress, and better issue detection and resolution.
- The disadvantages of EVM are that it doesn’t take project quality into account and is highly dependent on accurate data.
What is earned value management (EVM)?
Earned value management (EVM) is a project management methodology that combines project scope, schedule, and costs to measure project performance and progress. Using the core EVM concepts based on past trends, project managers can predict the project’s future and make informed decisions and course corrections when necessary.
An earned value management system (EVMS) is the framework that comprises the processes, tools, and people involved in the implementation of EVM within an organization.
The method used to collect the objective performance data for EVM is called earned value analysis (EVA).

The fundamental concepts of earned value management
The 3 fundamental concepts of EVM include:
- Planned value (PV),
- Actual cost (AC), and
- Earned value (EV).
Once these values are known, project managers can perform 2 types of variance analysis:
- Cost variance (CV), and
- Schedule variance (SV).
Two performance indexes can also be calculated to check the project’s health:
- Cost performance index (CPI), and
- Schedule performance index (SPI).
Let’s learn about these concepts in more detail.
Planned value (PV)
Planned value (PV) is the amount of money you plan to spend on your project over a set period.
It is also known as the budgeted cost for work scheduled (BCWS).
The value of PV changes depending on which portion of the project you’re looking at. The total project budget is called the Budget at completion (BAC). BAC always has to equal the project’s total PV.
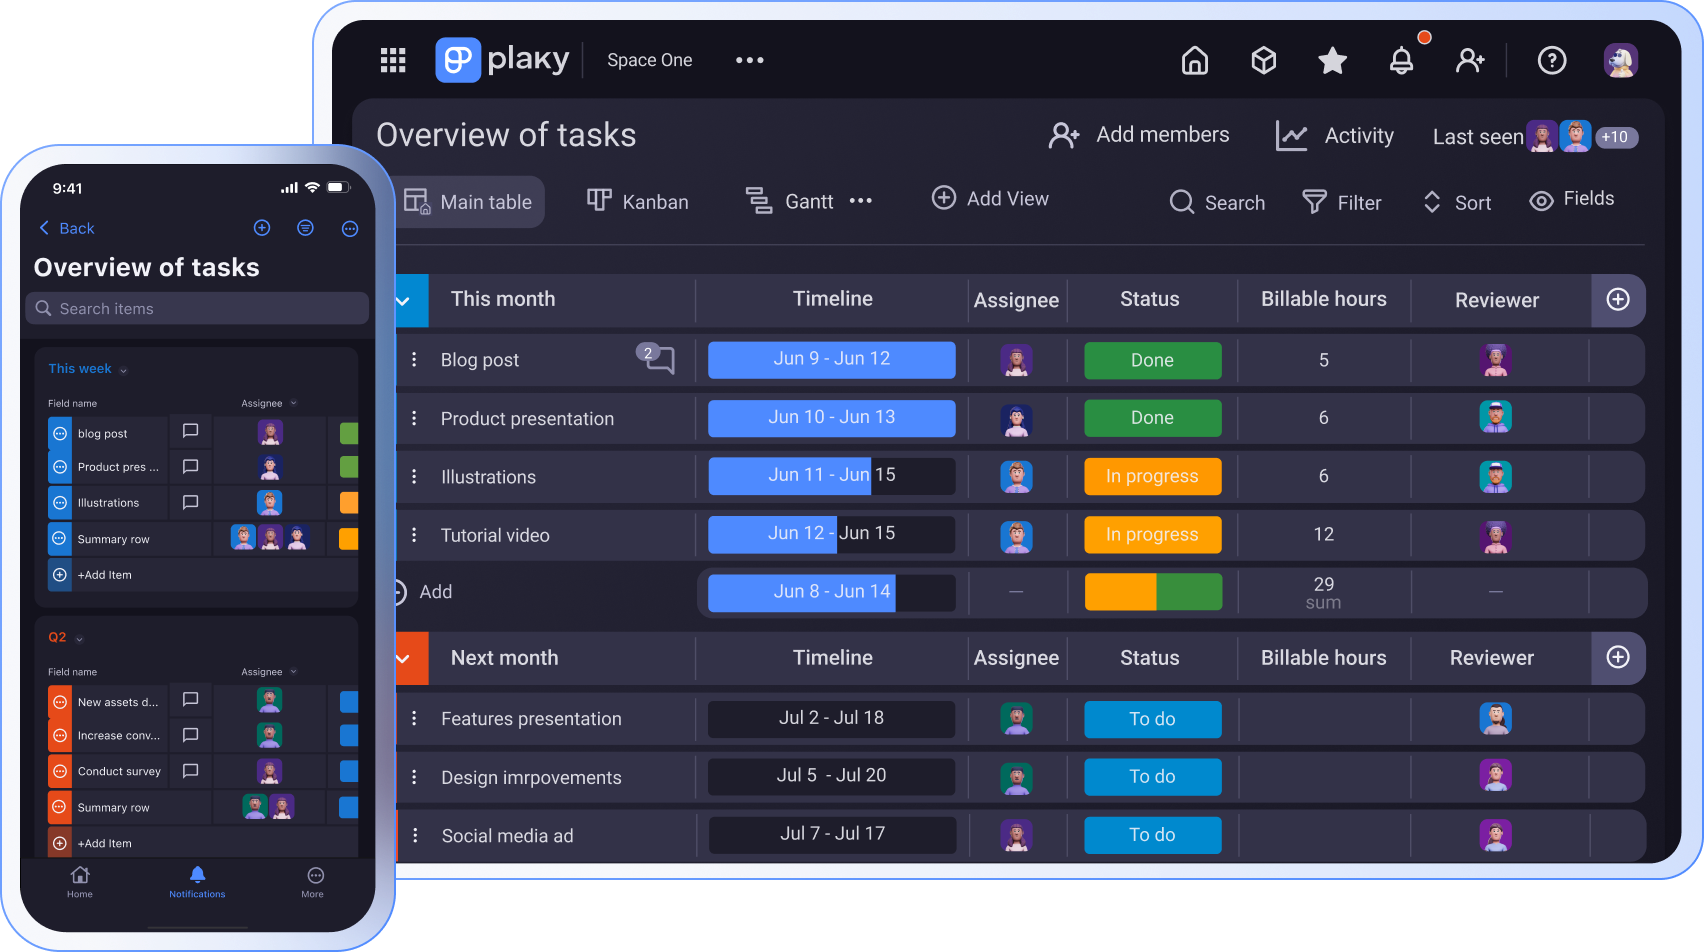
Let’s illustrate these 2 concepts with an example.
This means:
Suppose you have 4 days to paint your living room. You can allocate $20 per wall, so assuming the room has 4 walls, your total budget (BAC) is $80.
- PV for day 1 is $20,
- PV for the first 2 days is $40,
- PV for the first 3 days is $60,
- PV for all 4 days is $80 (total PV = BAC).
The painter also agrees to paint 1 wall a day, completing 25% of the work each day.
Actual cost (AC)
Actual cost (AC) refers to the amount of money that was really spent up to a certain point in time.
It is also known as the actual cost of work performed (ACWP).
There’s no formula for calculating AC, as it’s a sum of all project expenses, such as equipment and supplies, travel, employee compensation, etc.
Projects often have many hidden costs that project managers forget to include when calculating AC, which can then distort the analysis’s results.
For this reason, you should double-check your total expenditures before performing an earned value analysis.
We can take the same example as before to show what some possible hidden costs could look like.
For instance, let’s say that day 1 of your project was supposed to cost $20. But you didn’t have enough plastic sheets to cover all the furniture.
So, after spending an additional $15 on plastic sheets, the actual cost for day 1 was $35.
Earned value (EV)
Earned value (EV) represents the monetary value of the work performed up to a certain moment.
It is also known as the budgeted cost for work performed measure (BCWP).
A commonly used formula for calculating EV is:
EV = % of work completed x BAC
Ideally, EV and PV should be equal. However, they’re likely to differ due to the projects’ nature of often diverging from their original plans.
If we take a look at our example, we could say that the painter finished the first wall and half of the second one at the end of day 1. This would mean that 37.5% of work has been completed at the end of the first day.
Let’s apply the formula to calculate EV:
EV = 37.5% x $80
EV = $30
Another way to calculate EV is to count the number of completed units. In this case, the units would be the number of walls finished on day 1.The painter finished painting 1 + 0.5 walls, meaning that the value they’ve earned with their work (EV) on the first day is $20 + $20/2 = $30.
To recap, here’s how day 1 of the project went:
PV = $20
AC = $35
EV = $30
This means the painter has finished more work than originally planned, but you’ve also spent more money than planned.
So, your project is ahead of schedule and over budget.
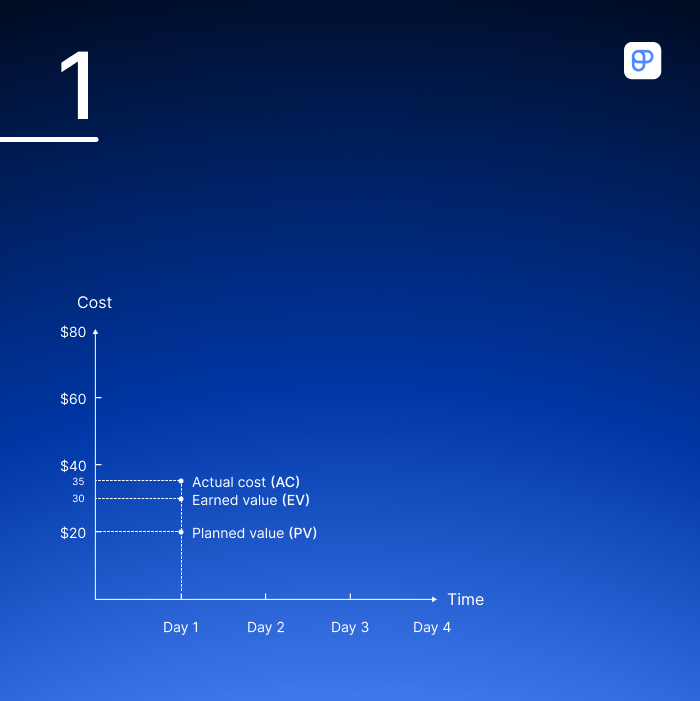
Cost variance (CV)
Cost variance (CV) determines how much the project is over or under budget by measuring the difference (variance) between the earned value and the actual cost.
The formula for calculating cost variance is:
CV = EV – AC
If the value you get from the formula is:
- Below 0 — you are over budget,
- Exactly 0 — you are within budget,
- Greater than 0 — you are under budget.
In our example, the earned value by the end of day 1 was $30, while the actual cost amounted to $35 due to the cost of plastic sheets.
We can now apply the cost variance formula as well.
CV = $30 – $35
CV = -$5
The negative result shows the project is currently $5 over budget.
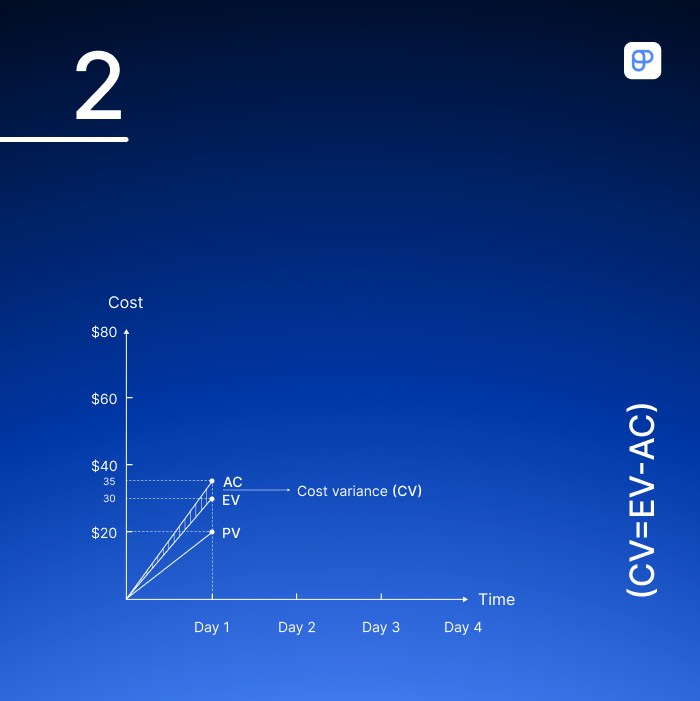
Schedule variance (SV)
Schedule variance (SV) determines how much the project has deviated from the planned schedule by measuring the difference between the earned value and the planned value.
The formula for calculating SV is:
SV = EV – PV
If the value you get from the formula is:
- Below 0 — you are behind schedule,
- Exactly 0 — you are on schedule,
- Greater than 0 — you are ahead of schedule.
Let’s go back to our example. You planned to spend $20 on day 1 (PV), but the value of the performed work for that day is $30 (EV).
We can now calculate the schedule variance at the end of day 1.
SV = $30 – $20
SV = $10
A value greater than 0 tells us this project is currently ahead of schedule.
Cost performance index (CPI)
The cost performance index (CPI) is the ratio between the earned value and the actual cost that shows how well the project is performing financially.
The formula for calculating CPI is:
CPI = EV / AC
If the value you get from the formula is:
- Below 1 — you are over budget,
- Exactly 1 — you are within budget,
- Greater than 1 — you are under budget.
Let’s apply the formula to our example:
CPI = $30 / $35
CPI = 0.86
This result tells us 2 things:
- The project is over budget, and
- For every dollar spent on the project so far, we have gained $0.86 in value.
💡 Plaky Pro Tip
Check out our guide for a more in-depth look at what the cost performance index is and how it works:
Schedule performance index (SPI)
The schedule performance index (SPI) is the ratio between the earned value and the planned value that shows whether the project has deviated from its planned work schedule.
The formula for calculating SPI is:
SPI = EV / PV
If the value you get from the formula is:
- Below 1 — you are behind schedule,
- Exactly 1 — you are on schedule,
- Greater than 1 — you are ahead of schedule.
Let’s apply the formula:
SPI = $30 / $20
SPI = 1.5
The value of SPI is greater than 1, which means the project is ahead of schedule.
💡 Plaky Pro Tip
In the guide below, we cover the schedule performance index in more detail:
Track key EVM concepts in Plaky
Advanced implementations of EVM
Project managers can also make predictions about their project’s future behavior with the following advanced EVM concepts:
- Estimate at completion (EAC),
- Estimate to complete (ETC),
- Variance at completion (VAC), and
- To complete performance index (TCPI).
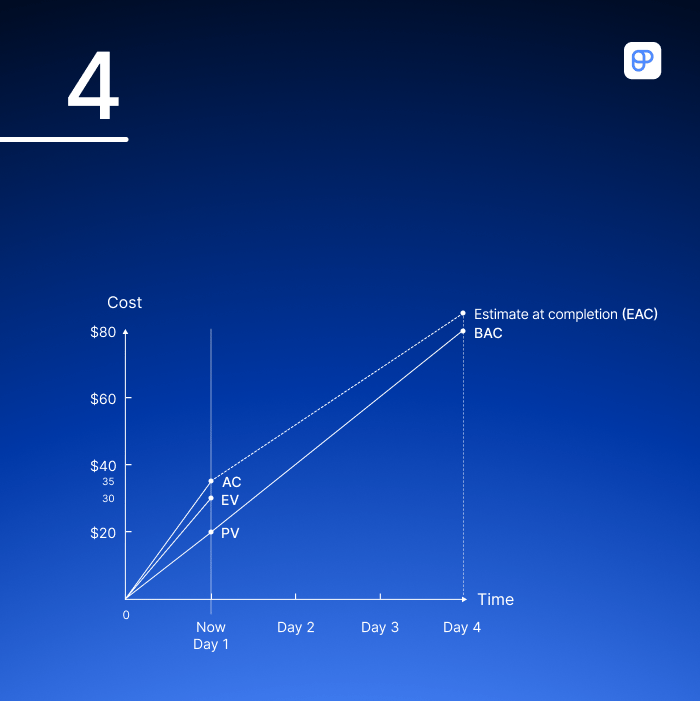
Estimate at completion (EAC)
Estimate at completion (EAC) is the estimate of the project’s total cost when it’s completed, based on the data collected so far.
After all the variances are calculated, the EAC will likely differ from the original total budget approved for the project (BAC).
There are several ways to calculate the EAC that vary according to the project’s circumstances as shown in the table below.
| EAC formulas | When to use |
|---|---|
| EAC = AC + bottom-up ETC | The original EAC is based on flawed data or the project’s circumstances have changed. To calculate the bottom-up ETC, each team member must estimate the total cost of the remaining work. |
| EAC = AC + BAC – EV | The original project budget (BAC) has remained the same throughout the project, and any variances were likely the result of a one-time event. |
| EAC = BAC / CPI | No changes were made to the cost performance index by the end of the project. The project’s future performance is expected to be the same as its past performance. |
| EAC = AC + [(BAC – EV) / (CPI * SPI)] | The project hasn’t been going according to plan, and both the cost and schedule performance indexes are showing unfavorable results. |
In our example, the project is over budget at the end of day 1.
So far, there have been no changes to the total budget for the project. The only deviation that occurred is not expected to happen again because we have enough plastic sheets to cover all the furniture now.
So, we should apply the second formula from the table:
EAC = AC + BAC – EV
EAC = $35 + $80 – $30
EAC = $85
The result tells us that if the project continues on the same track, the total cost of the paint job by the end of day 4 will be $85.
💡 Plaky Pro Tip
Estimate at completion is an advanced concept that’s crucial to an effective earned value analysis. To find out more about it, take a look at our detailed guide:
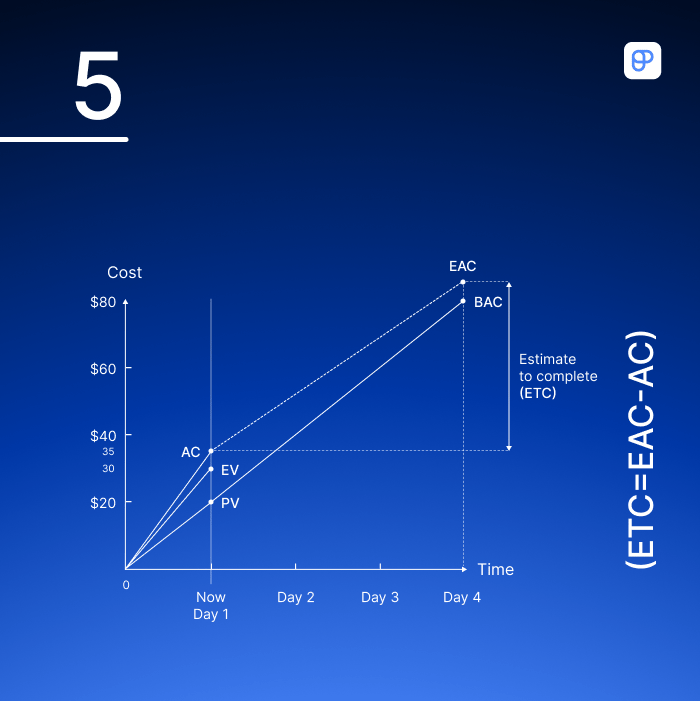
Estimate to complete (ETC)
Estimate to complete (ETC) shows how much you can expect to be over budget by the end of the project based on previous data.
The formula for calculating ETC is:
ETC = EAC – AC
Using the previously calculated EAC, we can now get an estimate of the remaining cost required to complete the project (ETC).
ETC = $85 – $35
ETC = $50
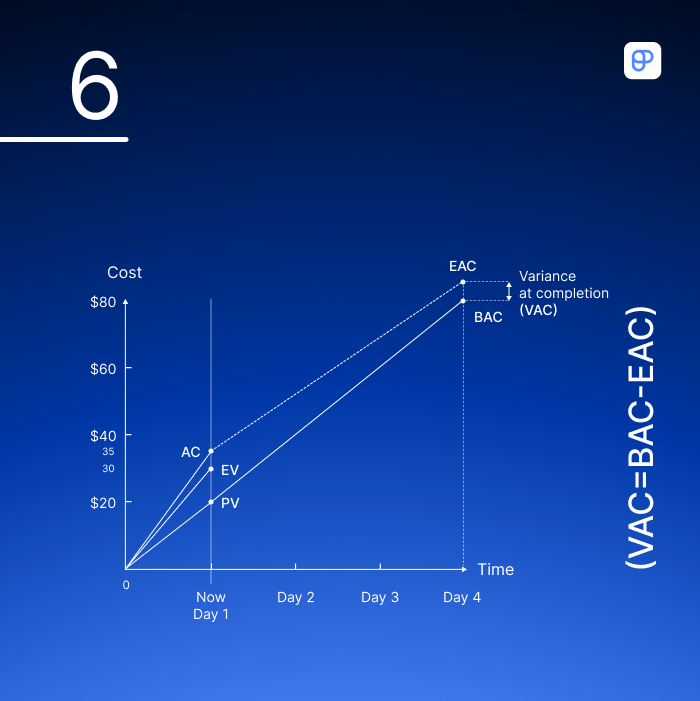
Variance at completion (VAC)
Variance at completion (VAC) shows us the expected budget deficit or surplus by measuring the difference between the budget at completion (BAC) and the estimate at completion (EAC).
A negative VAC value indicates the project is expected to go over budget. Alternatively, a positive VAC value suggests an expected positive outcome.
The formula for calculating VAC is:
VAC = BAC – EAC
Let’s see how much the project will deviate from its original budget (VAC) by the end.
VAC = $80 – $85
VAC = -$5
The negative VAC value indicates that we can expect a $5 deficit by the end of day 4.
To complete performance index (TCPI)
To complete performance index (TCPI) determines the amount of work the project team needs to complete per cost unit to finish the project within budget.
We can determine the value of TCPI by dividing all the remaining work by the remaining project funds.
The formulas for calculating TCPI are:
TCPI = (BAC – EV) / (EAC – AC)
or
TCPI = (BAC – EV) / (BAC – AC)
We can use the first formula to calculate a potential “what if” scenario. If the original BAC no longer applies, you can use this formula to calculate how much work you need to finish per cost unit to complete the project within the EAC.
If the value you get from one of these formulas is:
- Below 1 — the project will be easier to complete,
- Exactly 1 — the project will require the same level of efficiency to complete, and
- Greater than 1 — the project will be harder to complete.
Using the same example, we can now apply the second formula to determine the efficiency we should uphold until the end of the project timeline.
TCPI = ($80 – $30) / ($80 – $35)
TCPI = 1.1
The result indicates that for every unit of cost, it’s necessary to complete 1.1 units of work.
Earned value management formulas
Here’s a quick overview of all the concepts and formulas we’ve covered.
| Name | Description | Formula |
|---|---|---|
| Budget at Completion (BAC) | Total project budget. | None |
| Planned Value (PV)/ Budgeted Cost for Work Scheduled (BCWS) | Planned budget assigned to scheduled work. | None |
| Earned Value (EV)/ Budgeted Cost for Work Performed (BCWP) | Earned monetary value of performed work. | None |
| Actual Cost (AC)/ Actual Cost of Work Performed (ACWP) | Actual expense of performed work. | None |
| Cost Variance (CV) | Difference between EV and AC. | CV = EV – AC |
| Cost Performance Index (CPI) | Ratio between EV and AC. | CV = EV / AC |
| Schedule Variance (SV) | Difference between EV and PV. | SV = EV – PV |
| Schedule Performance Index (SPI) | Ratio between EV and PV. | SPI = EV / PV |
| Estimate at Completion (EAC) | Projected total cost based on existing data. | EAC = AC + ETC;EAC = AC + BAC – EV;EAC = BAC / CPI;EAC = AC + (BAC – EV) / (CPI * SPI) |
| Estimate to Complete (ETC) | Estimated remaining project cost. | ETC = EAC – AC |
| Variance at Completion (VAC) | Difference between the initial and the latest estimate of total project budget cost. | VAC = BAC – EAC |
| To Complete Performance Index (TCPI) | Cost performance needed to complete project goals. | TCPI = (BAC – EV) / (BAC – AC) |
Benefits of earned value management
Calculating EVM and all its components might be considered an additional task for the already overwhelmed project managers. However, the extra effort can be rewarded with benefits such as:
- Accurate performance measurement — integrating schedule, cost, and technical elements allows project managers to accurately measure performance and progress against project baselines,
- Early problem detection — potential problems like overstepping the budget or falling behind schedule and breaching the project deadline can be detected early and fixed before becoming severe,
- Improved reporting — project managers can offer more accurate reporting to project stakeholders and have a better understanding of the source and reason behind different issues, and
- Reduced risk — project risk can be reduced significantly thanks to the ability to recognize trends and predict future performance based on those trends with relative accuracy.
EVM can also be used to reflect on your past wins and losses. As Leigh Ann Gunther, PMP, VP of Education at PMI Delaware Valley Chapter, and Senior Technical Project Manager, explains it:

“Earned value management techniques can be best suited for “look-backs” and past performance reviews to assess how a team did in previous periods of the project or product. Value measurements like planned value, actual costs, and earned value calculated as a “look-back” can help project estimates at completion performance indexes.”
And though EVM can seem complicated, Leigh Ann believes “having the knowledge in your toolkit to pull out at the opportune time is enormous.”
“Years passed before I saw an opportunity to use this technique, and the payoff was huge. I was the Product Owner when leadership began to question whether or not the organization should continue to sponsor my product and whether or not the result was financially in our long-term interest. I grabbed my old PMBOK Guide, built an earned value analysis of the product, and projected forward based on past performance. My leadership was so impressed and heaped praise.”
💡 Plaky Pro Tip
How do you effectively manage and respond to positive and negative risks? Learn all about project risk management in our guide:
Limitations of earned value management
Although the benefits of using EVM are appealing to many project managers, there are some limitations when it comes to applying this method:
- Dependent on accurate data — using EVM requires meticulousness in collecting and checking data, as a single mistake can render your EVA useless.
- Quality is assumed — EVM doesn’t factor in project quality, so even a project that’s under budget could be unsuccessful if it results in a poor-quality product.
- Fits only certain project types — EVM is well suited for Waterfall projects (e.g., construction, engineering, or manufacturing projects) but may be challenging to implement in Agile projects or fast-paced projects that deal with more than one variable element.
Complexity is a potential roadblock too. As the expert we consulted, Leigh Ann Gunther, puts it:
“Because of the velocity at which we experience market changes, shifting priorities, and evolving requirements, many organizations are adopting hybrid project and product management approaches. Unfortunately, many techniques leveraged in earned value management need plans, timelines, resources, requirements, and people identified and, hopefully, agreed upon upfront.”
According to Tres Roeder, PMP, PMI-ACP-certified President of Roeder Consulting and the author of A Sixth Sense for Project Management and Managing Project Stakeholders, EVM can also “send project teams astray when it is applied in the wrong situations.”

“Because EVM is only measuring completion of tasks against budget, it can be misleading. For example, let’s say you’re leading an effort where the value is not realized until the project is completely finished. In this situation, you have not received 50% of the value when milestones are 50% complete. Instead, you receive 0% of the value until the project is 100% complete. EVM is not the right metric in this situation.”

FAQs about earned value management
Now that you’ve learned all about the core EVM concepts and formulas, let’s answer some frequently asked questions about this project management technique.
What are the 3 earned value methods?
According to The Standard for Earned Value Management, earned value measurement methods are categorized into 3 classes of work:
- Discrete effort — activities with specific work breakdown structure (WBS) outputs that can be planned and measured,
- Apportioned effort — activities that support and can be measured in direct proportion to discrete effort, and
- Level of effort (LOE) — activities that don’t result in specific measurable outputs and are instead determined by the passage of time.
Discrete effort consists of 4 measurement methods:
- Fixed formula — each activity is assigned a specific percentage at the start and when it’s completed (usually 0/100%, 50/50%, or 25/75%),
- Weighted milestone — each project milestone is given a budget value, which is earned by hitting the milestone,
- Percent complete — an estimated percentage complete is applied to the BAC to determine EV, and
- Physical measurement — a physical count is used to measure EV, e.g., the number of products made in a month.
💡 Plaky Pro Tip
To earn value through your work on your project, you have to carry out various project activities. Check out our guide to learn what project activities are and how to define them when planning your project:
What are the steps to doing earned value analysis in project management?
Earned value analysis usually involves the following 5 steps:
- Find out the level of completion for each task (e.g., percent complete),
- Determine planned value, earned value, and actual cost,
- Calculate cost and schedule variances,
- Calculate other EVM indicators, such as schedule and cost performance indices, and
- Collect and interpret the data.
Since EVA is essentially a snapshot of your project’s current performance, you can determine when to check the project status in advance (e.g., every 2 weeks).
What kinds of projects can benefit from earned value management?
EVM can prove beneficial in larger projects, such as:
- Multi-million dollar, large-scale development projects,
- Government projects, such as defense, energy, utility, transportation, urban development, and housing projects,
- Major engineering and construction projects, and
- Projects under cost-reimbursable (cost-plus) or incentive contracts.
An expert we consulted, Tres Roeder, explained when to use EVM in a project:
“If you have a budget that is linear over time, and if spending money is synonymous to progress towards value realization, then EVM can be a good metric. Otherwise, don’t use it.”
Due to its complexity and strictness, EVM is also more suitable for product development than service delivery and maintenance projects.
One of the biggest supporters and users of EVM is the US government. For example, in NASA, an EIA-748-compliant EVMS is needed for development or production contracts worth $20 million or more.
However, small-scale projects can also benefit from EVM.
A 2015 paper on the use of earned value-based metrics on small-scale construction projects published in the European Journal of Applied Economics indicates that EVM could serve as an “early warning tool for project teams” that shows if something’s not going according to plan and thus helps prevent “greater consequences in terms of sliding cost, time, or scope.”
📖 Now that you’re familiar with EVM terminology, you might be interested in delving into our Project Management Glossary of Terms and expanding your general understanding of project management.
How to use Plaky to track your EVM project data
You may have concluded that tracking EVM data and creating detailed predictions can become complicated, especially when handling complex projects and measuring progress.
Yet, these activities can become simpler by organizing projects with project management software like Plaky.
Plaky can help you monitor each step of your project’s progress and deliver results on time by letting you:
- Use pre-made project templates to save time,
- Create an effective project roadmap,
- Organize your goals through project boards,
- Create a detailed project plan with assigned items,
- Set up due dates and tags to track the project schedule and costs,
- Stay informed and communicate regularly through task comments, and
- Share project-related files and reports with the team.

Here’s an example of how you could use Plaky to keep track of EVM parameters like CPI:
Use Plaky to harness the potential of earned value management. Start your 14-day free trial today.
How we reviewed this post: Our writers & editors monitor the posts and update them when new information becomes available, to keep them fresh and relevant.