Do you want to see how your tasks fit together or if they overlap on a timeline?
Are you looking for a better way to identify bottlenecks and resource conflicts before they escalate?
If so, then Gantt charts are your go-to tools for all these and much more.
Read on to learn more about Gantt charts, what they are used for, and how to build them.
Let’s get started!
- A Gantt chart is a project management tool that provides a visual project timeline and helps you track progress and plan project activities more effectively.
- Gantt charts have 2 sections — chart grid on the left and chart timeline on the right.
- They are used across industries like project management, construction, manufacturing, event planning, etc.
- You can use Gantt charts to create a project timeline, identify the critical path, manage resources, see task dependencies, track progress, and collaborate with your team and stakeholders.
- The 5 steps you need to take to build a Gantt chart are: determine the project scope, choose the right Gantt tool, list project tasks, estimate resources and task durations, and allocate resources and collaborate.
What is a Gantt chart in project management?
A Gantt chart is a project management tool that provides a visual representation of tasks, timelines, milestones, dependencies between tasks, and assignees.
Therefore, it’s not surprising that Forbes praises Gantt charts as one of the most important predictive project management techniques.
Gantt charts typically show:
- The name and length of each task,
- The order in which tasks will be completed,
- Tasks’ start and end dates on a project timeline,
- Task interconnections, and
- Team members responsible for each task.
What is the purpose of a Gantt chart?
The main purpose of Gantt charts in project management is to lay out project tasks or activities in the order in which they need to be completed and provide a comprehensive project insight.
The clean visual layout of the project timeline in Gantt view helps you determine exactly:
- How far along the project is,
- What tasks are ahead or behind schedule, and
- Whether the schedule needs adjustment.
A Gantt chart is one of the most useful tools you can have to help you improve estimates, create a project timeline, manage team workload, and organize the project schedule.
You can use Gantt charts to effectively plan, manage, and monitor business processes in industries like construction, software engineering, manufacturing, and event planning. What’s more, Gantt charts offer a holistic view of the entire project, which is ideal for keeping stakeholders in the loop.
Project, program, portfolio, and operations managers across industries make use of Gantt charts as these help them and their teams to:
- Get a bird’s eye view of the project,
- Identify connections between tasks,
- Understand how their responsibilities relate to and affect other tasks in the pipeline,
- Plan different phases of the project,
- Create project roadmaps, and
- Simplify resource planning and allocation.
Benefits of using a Gantt chart in project management
Gantt charts are effective tools that ease your project management in many ways — from giving you the big picture of your project progress to helping you collaborate with team members and stakeholders.
Let’s look at some of the benefits Gantt charts bring to your work.
#1 Clear project timeline
The easiest way to improve your project scheduling and task management is to create a project timeline — and Gantt charts are perfect for this.
But, to create a timeline, you first need to define a task list, and the best way to do it is by using a work breakdown structure (WBS). This tool will help you break down your project into individual tasks and make it easier to determine their order and length.
Once you define the start and end dates for each task, you can create a project timeline within a Gantt chart.
Having these dates in place lets you plan, schedule, and shuffle around tasks within those time frames so that you can meet deadlines or hit project goals on time.
Manage tasks with ease in Plaky
#2 Highly visible critical path
When you have the Gantt chart in front of you, it’s much easier to find the critical path.
The critical path is the longest sequence of dependent project tasks that you need to complete. Therefore, any delays on the critical path automatically extend the duration of the entire project.
Luckily, tools such as Plaky by CAKE.com automatically calculate the duration of all tasks within an item group. From here, you can identify the groups on the critical path and see how long they’ll take to complete.
Thanks to this, you’ll be able to:
- Understand how you can stretch the deadlines for the tasks outside the critical path.
- Find a way to shorten the critical path and overall project duration.
- Make more informed decisions in terms of planning and scheduling and move your project forward.
#3 Transparent task dependencies
As a project manager, you need to determine the order of tasks within a project to structure the timeline accurately. After all, project tasks and activities have their logical sequence — you must finish some tasks so that others could start.
Gantt charts are ideal to identify and visualize these task dependencies — you can clearly see the relationship between tasks and distribute resources properly. Also, by tracking progress on the timeline, you’ll be able to identify potential delays or bottlenecks and make timely adjustments.
#4 Efficient resource management
Gantt charts are also a great tool for tracking and allocating resources.
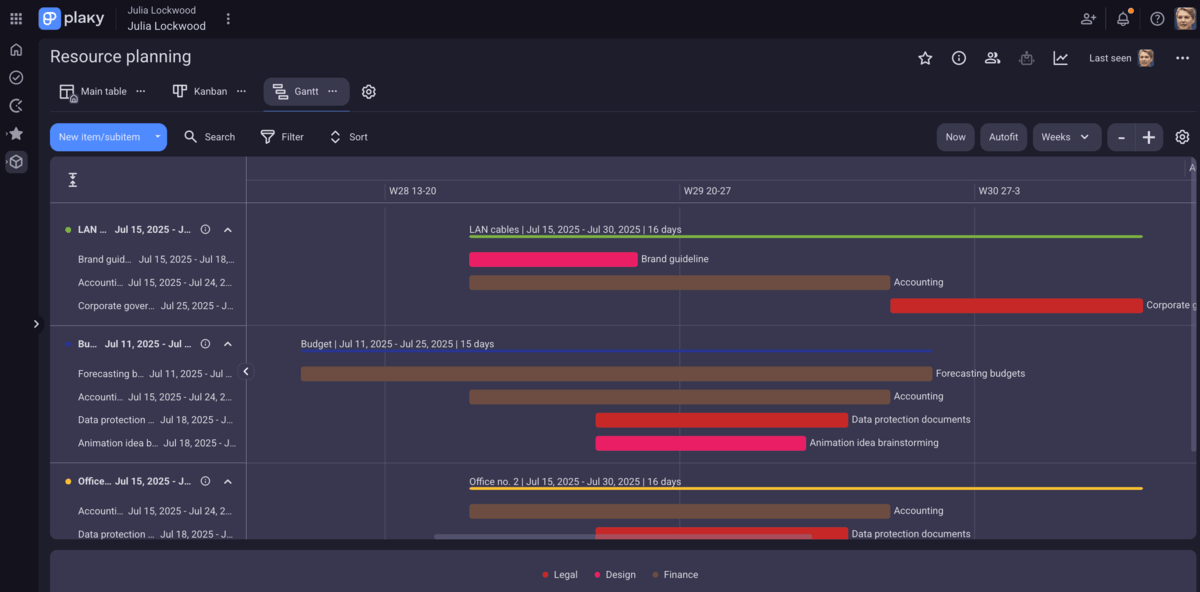
For example, in Plaky’s Gantt chart view, you can easily check the availability of your team members by grouping tasks by the person they’re assigned to.
Having insight into team members’ availability lets you see when an employee is overbooked and reshuffle the tasks accordingly. This helps prevent burnout in your team and can even speed up the project by helping you make better use of your team resources.
Similarly, you can even track the availability of material resources and manage their distribution throughout the Gantt chart filtering system.
Allocate resources easily in Plaky
#5 Simple project tracking
Never forget that even if you’ve drawn up the best project schedule in the world, it won’t matter if you don’t track the project’s progress and adjust the schedule as needed. You can customize your Gantt chart to only display the information you want to track.
Of course, this involves some tinkering with your preferred tool’s Gantt chart settings. For instance, in Plaky, you can categorize the Gantt tasks by different criteria, including:
- Status — to keep an eye on individual task progress, or
- Assignee — to monitor how many tasks your team members have to deal with in the upcoming period.
Based on this information alone, you can react promptly and make adjustments right in the Gantt chart. As a result, you enable faster progress and/or higher-quality project delivery.
#6 Direct collaboration with team members and stakeholders
Finally, if you use cloud-based Gantt chart software, you’ll be able to communicate with your team members and use Gantt charts for active project collaboration.
Thanks to the intuitive layout of Gantt charts, all team members can understand how their tasks affect other related tasks.
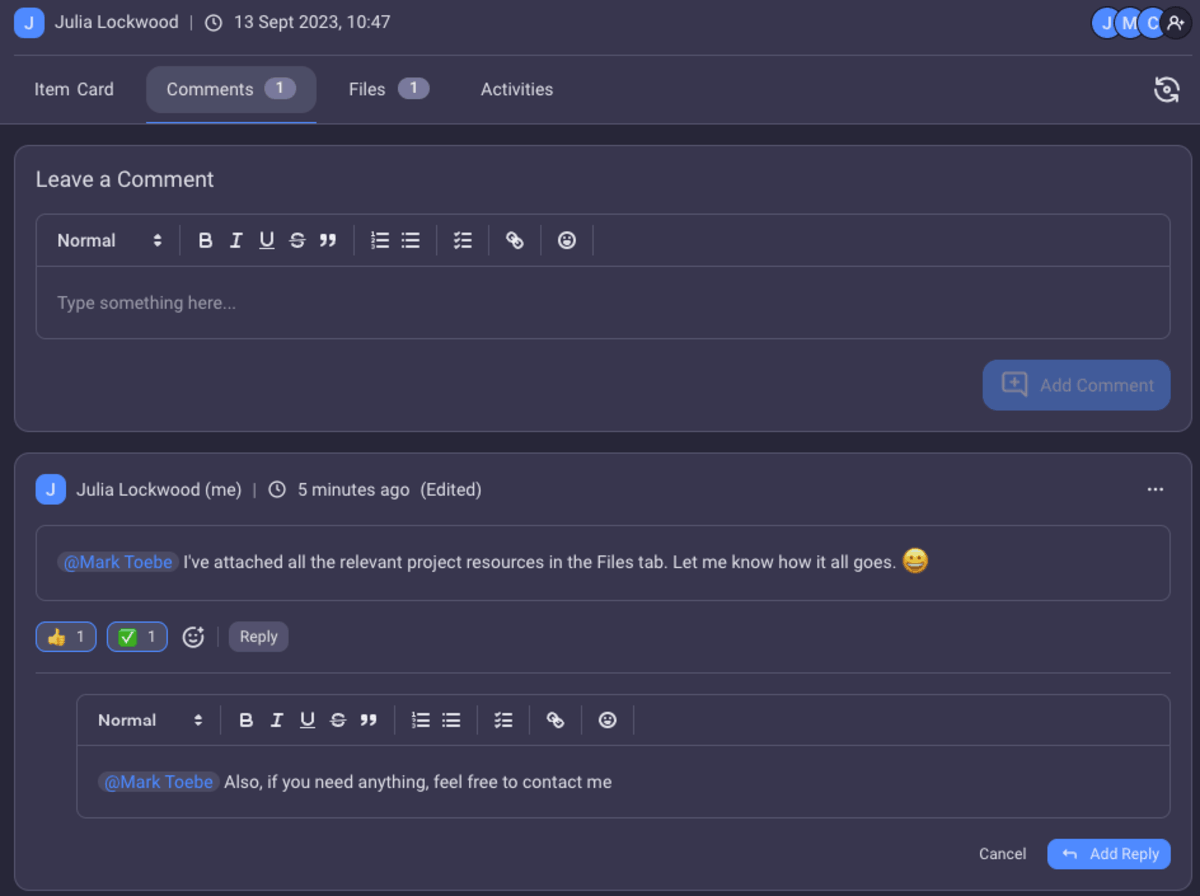
In Plaky, you can open task cards right from your Gantt chart view and go to the task card’s comment section where you can:
- Leave task updates and comments,
- Give feedback,
- Share related files,
- Have task-related discussions, and
- @mention your colleagues.
Additionally, you can invite your stakeholders to view the Gantt chart and keep in touch with changes or export relevant information in CSV format to share it along with project status reports.
Keep collaboration easy with Plaky
How to create a Gantt chart
Today, the simplest and most effective way to build and update a Gantt chart is by using Gantt chart software.
Take a look at the 5 steps to building a Gantt chart.
#1 Determine the project scope
To build your project Gantt chart you need a clearly defined project scope.
To determine what’s in and out of scope, you have to agree on project goals, budget, deliverables, and due dates with your team and stakeholders.
A defined scope helps you focus only on what’s within that scope, which makes it easier to:
- Set the project timeline,
- Stay within agreed boundaries, and
- Avoid team overload.
#2 Choose the right Gantt chart tool
Gantt charts are praised for their powerful visualization functionalities that help you understand your project better and boost collaboration.
They are perfect to manage more complex projects when you need to get an insight into multiple project phases, balance workloads, and improve clarity.
Now, when choosing the right Gantt chart tool, make sure it provides:
- Detailed, but uncluttered charts,
- A complete overview of your project journey,
- A customizable timeline, and
- Collaboration features.
Also, keep in mind that Gantt charts are usually locked behind the paywall. Make sure you don’t overpay for features you’ll never need, just to get access to Gantt charts.
💡 PLAKY PRO TIP
If you have no clue what kind of Gantt chart tool would suit your needs, check out this list of 12 best Gantt chart tools:
#3 List project tasks
Thanks to a previously defined project scope, you can list every task and subtask necessary to complete your project.
By identifying all tasks and dividing them into manageable chunks, you’ll be able to control project execution, without missing a thing.
Also, you need to define start and end dates for your tasks so that you can clearly see a timeline for each task in your Gantt chart.
#4 Estimate project resources and task durations
Based on the agreed project scope, you need to estimate the amount of resources you need, including:
- Time,
- Number of people, and
- Budget.
Once you’ve done that, you can estimate task durations since your resources dictate the amount of time you’ll need to complete tasks.
As for task durations, try to be realistic and rely on lessons learned from previous projects with similar tasks. Consider potential delays, and include buffers to absorb unexpected delays or issues.
#5 Allocate resources effectively and collaborate
Assign each task to the right team member(s) so that you can ensure clear ownership and increase accountability.
When you allocate resources like costs or equipment, make sure you:
- Base decisions on strategic importance,
- Prioritize spending on objectives, and
- Provide equipment where it’s mostly needed.
Manage your resources with Plaky
Gantt chart examples
One cool thing about Gantt charts is that you can use them in all kinds of industries and fields. Here are some Gantt chart examples for software engineering and construction projects.
Software engineering Gantt chart example
Software engineering projects are mostly Agile, with the work done in Sprints and frequent changes happening throughout the project lifecycle.
But even so, you can use Gantt charts to map out the software development plan and give an overview of the planned project timeline to help with further Sprint planning and scheduling.
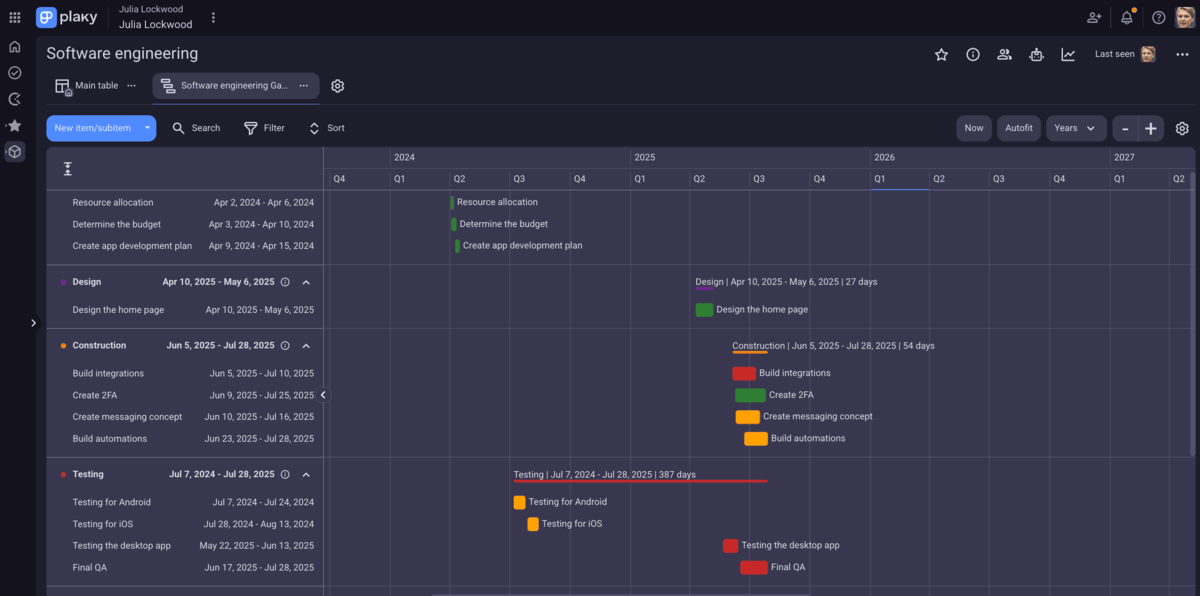
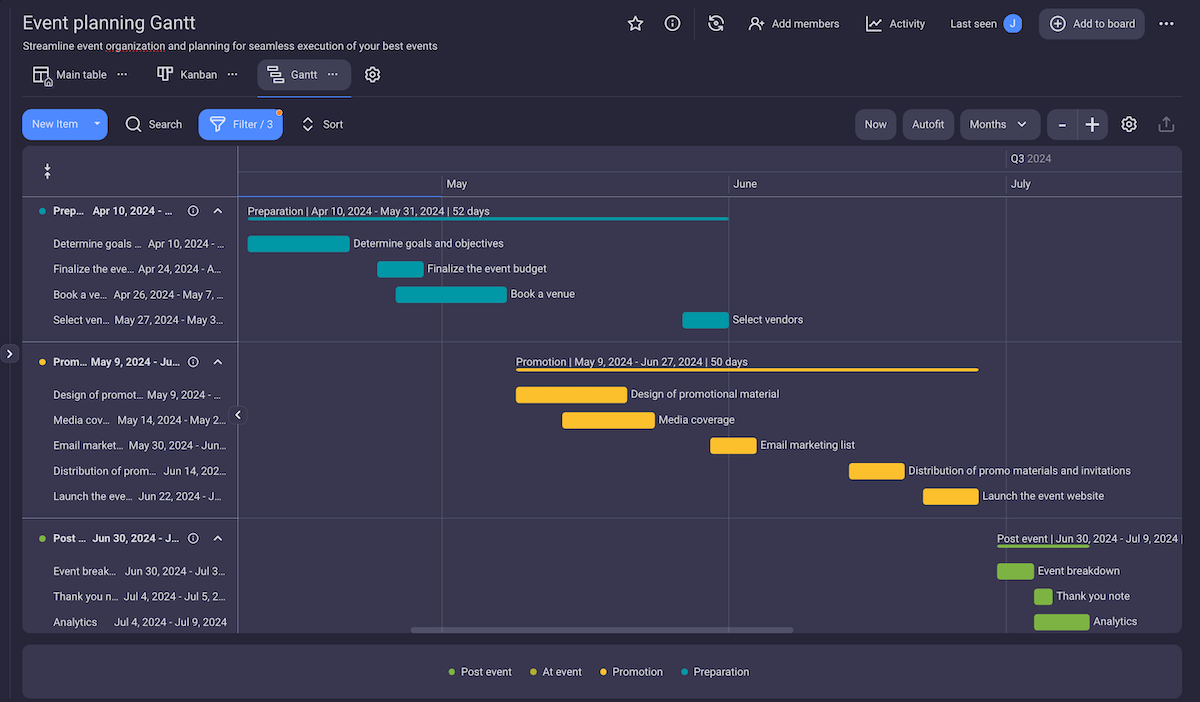
This Gantt chart example offers an overview of the planned time frames for different project phases, their due dates, and their timeline. The task bars are color-coded by status making it easy to see if all your tasks are on track.
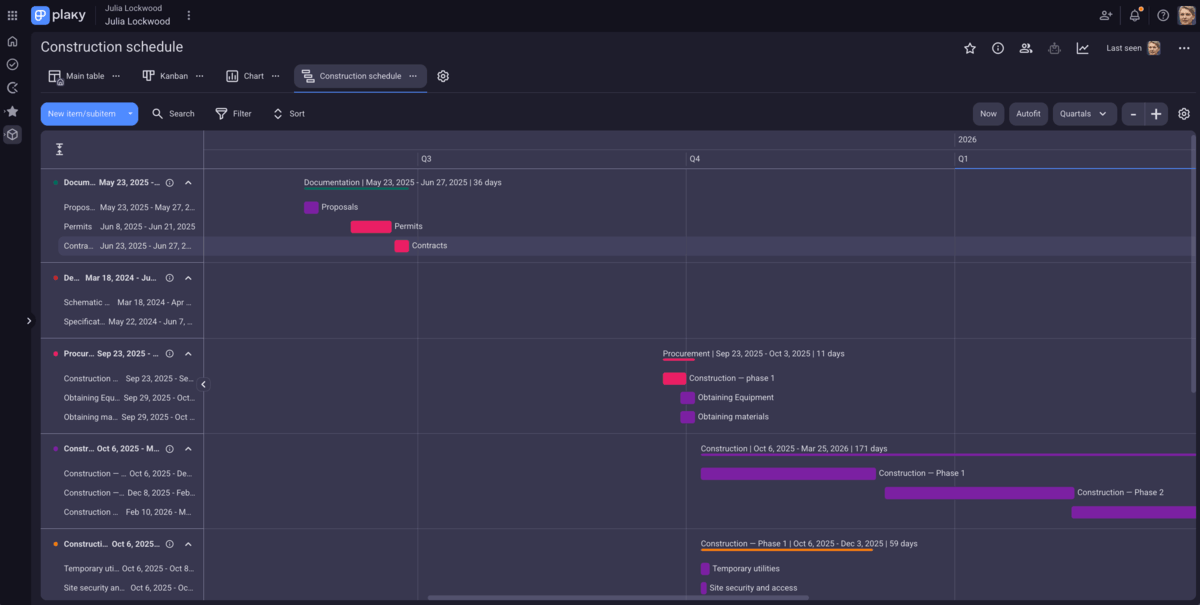
Constructions project Gantt chart example
Same as with software engineering, construction projects are also divided into phases and require strict deadlines and a clear and organized project timeline.
In Plaky by CAKE.com, you can track different types of tasks such as documentation, design, procurement, construction, and everything else related to your project in one Gantt chart.
Boost your project management with dynamic Gantt charts in Plaky by CAKE.com
A Gantt chart is an advanced project management tool that often comes at a premium price — but not always!
As a budget-friendly tool, Plaky is the perfect choice for any project manager or small business owner on a budget who’s looking to improve their scheduling and tracking with Gantt charts.
Try Gantt charts in Plaky for free
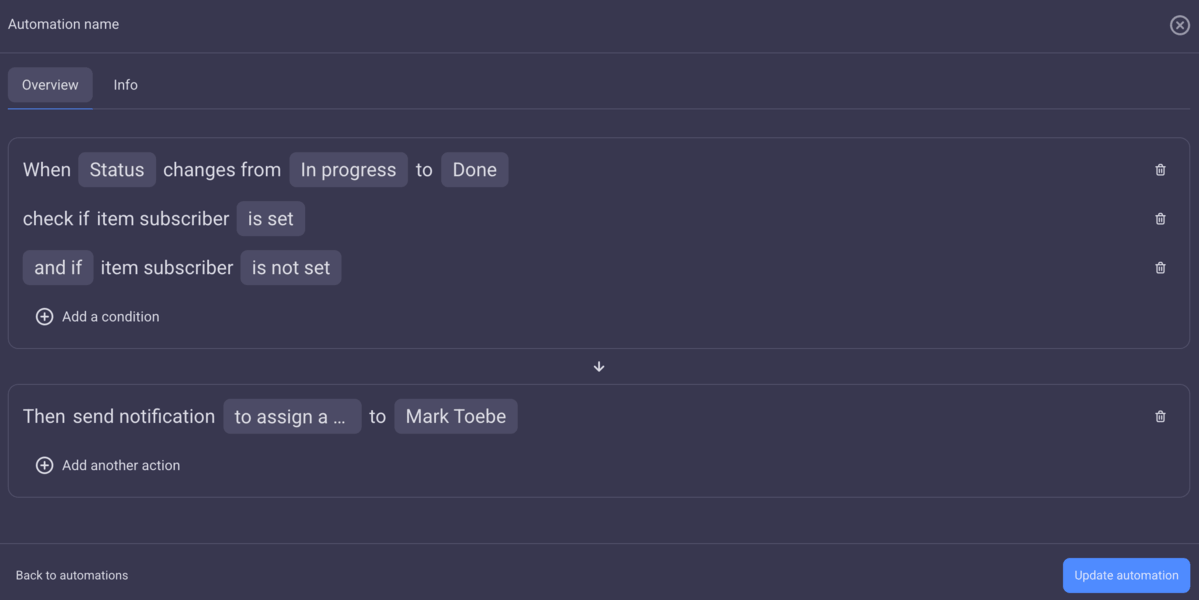
But, Plaky’s affordable paid plans don’t only give you access to Gantt charts. You can also count on board automations to help you streamline processes and reduce manual work.
And there’s more!
Plaky by CAKE.com is extremely user-friendly (even for non-techies), highly versatile, and customizable — and comes with a host of other features that make project management a breeze:
- Project management templates — Use them when you don’t want to start projects from scratch.
- Subitems — Divide your tasks into subtasks to improve clarity and organization.
- Custom fields — Add relevant details to your project with fields like Person, Status, Date, and more.
- Sorting and filtering — Focus on essential information, and hide what you don’t need.
- Real-time notifications — Stay up-to-date with any changes, and work more efficiently.
Best of all?
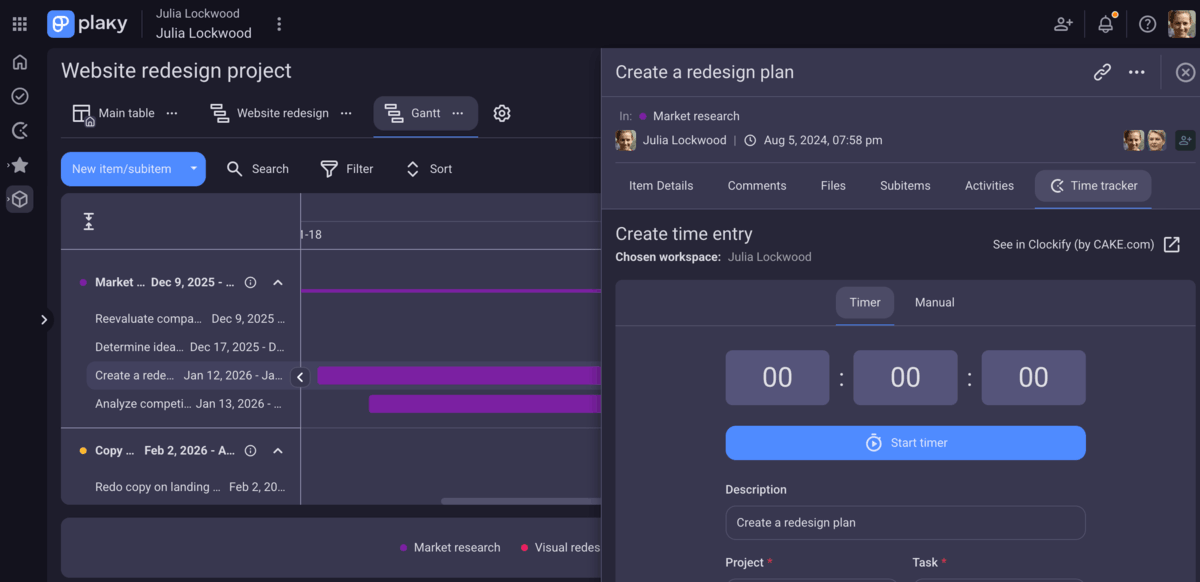
As of recently, you can have a built-in time tracker for all your tasks thanks to Plaky + Clockify integration. This will help you measure the time spent on tasks and eventually spot behavior patterns that might cause problems.
So, what are you waiting for? Manage projects and improve collaboration with Plaky’s Gantt charts. Sign up for Plaky today!
Get started with Plaky by CAKE.com