 Updated: March 5, 2025
 Project diagrams are one of the many tools managers use to turn a complicated net of tasks into a simple overview of all the steps toward project completion.
Sometimes, complex projects have too many components, and keeping track of them becomes too confusing. Creating a visual project network diagram helps the entire team understand where they’re at and what’s coming up next.
Find out how to create the perfect diagram for your projects and manage them more easily!

- A project network diagram is a graphical representation of project activities, their flow, and their interconnections.
- The 2 main types of project network diagrams are the activity-on-arrow (AOA) and the activity-on-node (AON).
- The PDM diagram is more common nowadays and comprises a series of nodes, which represent activities, and arrows, which indicate the dependencies between those activities.
- To make an accurate project network diagram, it’s necessary to properly define the project activities, estimate their duration, and establish their dependencies.
What is a network diagram in project management?
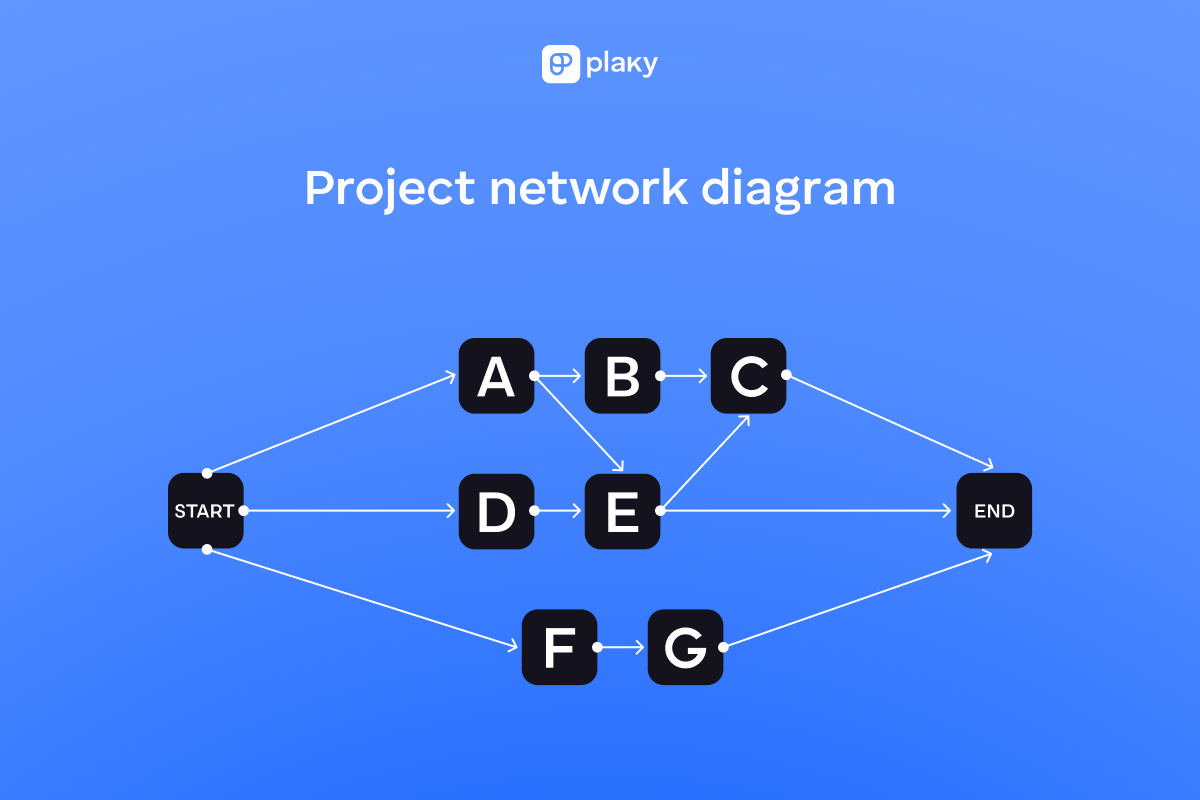
A project network diagram is a visual tool made of boxes and arrows that maps out the sequence of project activities and their dependencies.
Project network diagrams are used in project management to track the project’s progress and the entire workflow visually.
A project schedule is often shown in the form of a graph, such as a Gantt chart, a milestone chart, or a project schedule network diagram.
A project schedule network diagram is a graphical representation of project schedule activities and their interconnections.
Project activities share logical relationships or dependencies that managers use to sequence and schedule them.
A project network diagram depicts those elements, acting as a visual project roadmap that guides the project manager through the project’s life cycle.
There is no significant difference between the project network diagram and the project schedule network diagram. The latter only focuses more on sequencing activities and placing them on a timeline.
Today, these diagrams are made in project management software, but they can also be drawn manually. Either way, they should show project work chronologically, from left to right.
💡 Plaky Pro Tip
Sequencing activities is one of the processes of project time management. To learn more about project time management and its processes, check out the guide below:
Project network diagram vs. work breakdown structure (WBS)
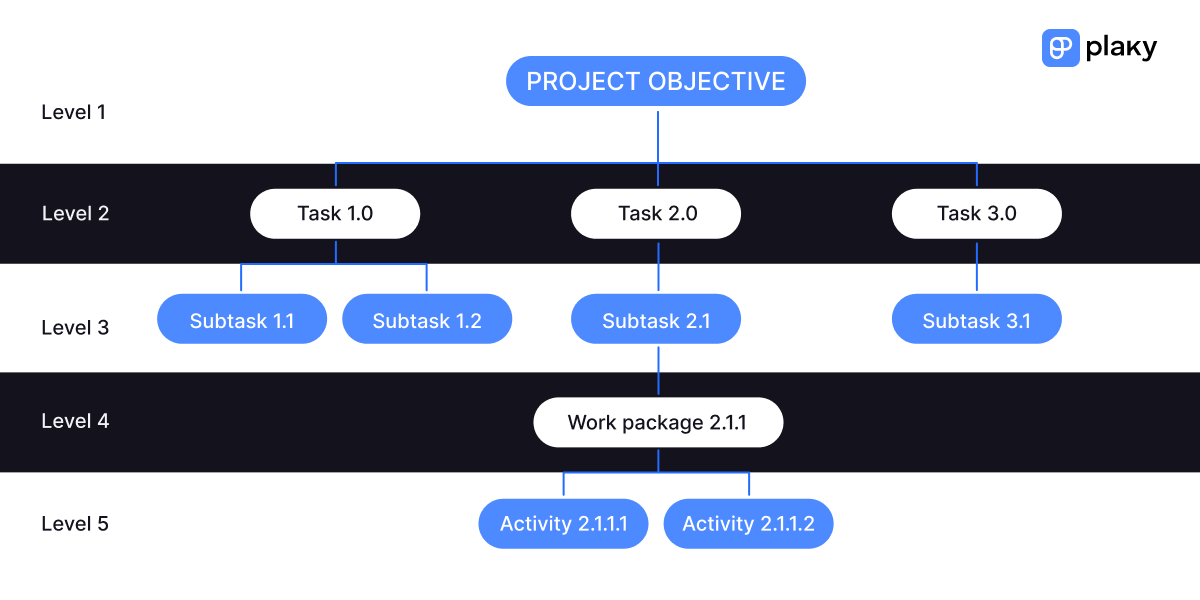
The main difference between a work breakdown structure (WBS) and a project network diagram is that a WBS doesn’t list project tasks chronologically.
A WBS is a hierarchical breakdown of the project that shows 100% of the project work divided into manageable components.
In contrast, a project network diagram has a sequential structure and shows project activities in the order they should be completed.
These 2 project management tools also differ in form. While a WBS often takes the form of a tree diagram, a project network diagram flows from left to right.
Types of project network diagrams
There are 2 main types of project network diagrams:
- Arrow diagram method (ADM) or activity-on-arrow (AOA) diagram, and
- Precedence diagram method (PDM) or activity-on-node (AON) diagram.
Both types are arrow diagrams, as they include arrows as key elements.
The main difference between these 2 diagrams is how they represent project milestones, activities, and their interconnections.
Let’s go through both in more detail.
Arrow diagram method (ADM)
The arrow diagram method (ADM) uses arrows to represent the project activities and nodes to depict major milestones or events. It’s also known as the activity-on-arrow diagram.
Traditionally, the nodes are drawn as circles. The first circle represents the start event and is also called the i-node. The other circle represents the finish event and is also called the j-node.
Between the nodes are the arrows, whose tails represent the start, while their heads mark the end of an activity.
The arrow itself shows the logical relationship between the activities, and the length of the arrow indicates an activity’s duration.
The ADM diagram only shows 1 type of activity relationship — finish-to-start (FS). Due to this, it might be necessary to include dummy activities as well — broken arrows that signify indirect relationships between tasks.
These dummy activities don’t take part in the sequence and have no duration. Instead, they indicate benchmarks that should be checked off before moving on to a certain activity.
A great example of the use of the arrow diagram method is PERT (Program Evaluation and Review Technique).
Precedence diagram method (PDM)
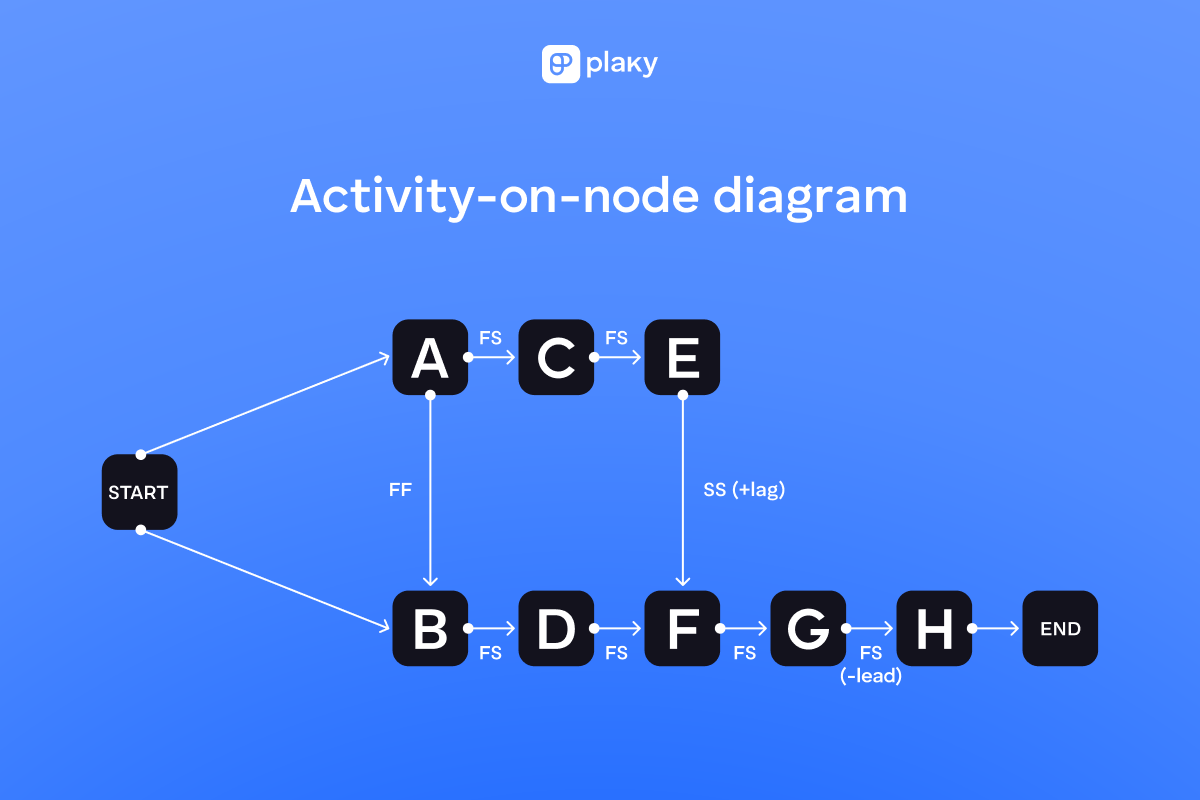
The precedence diagram method (PDM) uses nodes to represent project activities and arrows to reflect the dependencies between tasks. The PDM is also called the activity-on-node diagram.
The activity nodes are shown as boxes and linked with arrows. The arrows indicate the 4 types of task dependencies:
- Finish-to-start (FS) — The successor activity can begin only when the predecessor activity has been completed.
- Finish-to-finish (FF) — The successor activity can’t be finished until the predecessor activity has been completed.
- Start-to-start (SS) — The successor activity can’t begin until the predecessor activity has started.
- Start-to-finish (SF) — The successor activity can’t be finished until the predecessor activity has started.
Finish-to-start is the most common type of relationship between predecessor and successor activities, while start-to-finish is the rarest.
The PDM diagram can also capture lead and lag times.
Lead time is the overlap between 2 activities and is associated with the finish-to-start dependency. It refers to the amount of time a successor activity can begin in advance.
For instance, if Activity A lasts 5 days, and Activity B has a lead time of 1 day, Activity B can start 1 day before Activity A is completed.
Lag time is the delay between 2 activities and can be applied to tasks regardless of the dependency. It refers to the amount of time a successor activity can be delayed.
For example, if Activity C lasts 6 days, and Activity D has a lag time of 2 days, Activity D can only start 2 days after Activity C is completed.
In a PDM diagram, the lead and lag times can be marked on the arrows, denoted with – and + symbols.
How to create a project network diagram (+ example)
Creating a project network diagram is simple, especially when you know which steps to take. We’ll use an example to go through all the steps so that you can apply them more easily to your project.
#1 Identify and define project activities
The first step is to properly define project activities as they are the main components of the network diagram.
For example, let’s say that our project objective is to open a beauty salon. Let’s focus on the task of human resources.
When broken down, this task includes 2 subtasks:
- Recruitment and
- Training.
We’ll focus on the recruitment subtask, which consists of 4 work packages:
- Hire a receptionist,
- Hire a hairdresser,
- Hire a stylist, and
- Hire a makeup artist.
The activity list should contain activity attributes — descriptive components that further define each activity in your project.
These attributes provide key information about the activities, such as:
- Who’s responsible for task ownership,
- What kinds of project resources they require,
- Each activity’s level of effort, and
- Predecessor and successor activities.
Since this list defines the activity relationships (dependencies), it will also help us in the next steps of making an accurate diagram.
💡 Plaky Pro Tip
If you want to learn more about the recruitment process in HR and how to maximize its potential, check out the guide below:
#2 Make time estimates
Once you have your activity list, it’s time to estimate how long each activity will take.
According to Jan Schiller, Partner and Chief Project Officer at Berkshire Consulting LLC, making accurate estimates requires a bit more than just figuring out the length of each activity:

“The best estimates take both effort and duration into consideration and reflect the allocations of resource(s) performing the tasks. Create the estimate yourself if the resource(s) performing the task are not yet available. Validate your estimate with those resources when they become available.”
Generally speaking, you should be able to back up your estimates with knowledge or experience. However, estimates can also be based on project assumptions.
Some of the most commonly used estimation techniques to rely on for this step include:
- Analogous estimating (apportionment method),
- Parametric estimating,
- Expert judgment,
- Group decision making,
- Heuristic estimating (rule of thumb),
- Reserve analysis,
- Three-point estimation, and
- Bottom-up estimating.
For our example, we’ll use the following duration estimates:
- 1 day — activities A, B, C, D, G, I, J, K, L, M, and N,
- 2 days — activity F,
- 3 days — activity E, and
- 4 days — activity H.
💡 Plaky Pro Tip
Some of the estimation methods used to determine the duration of project activities are also used for project management budgeting. Learn more about them here:
#3 Map out the activity sequence
Now that we have an activity list and know each activity’s duration, we can focus on activity sequencing.
In our example, here’s how the activities are connected:
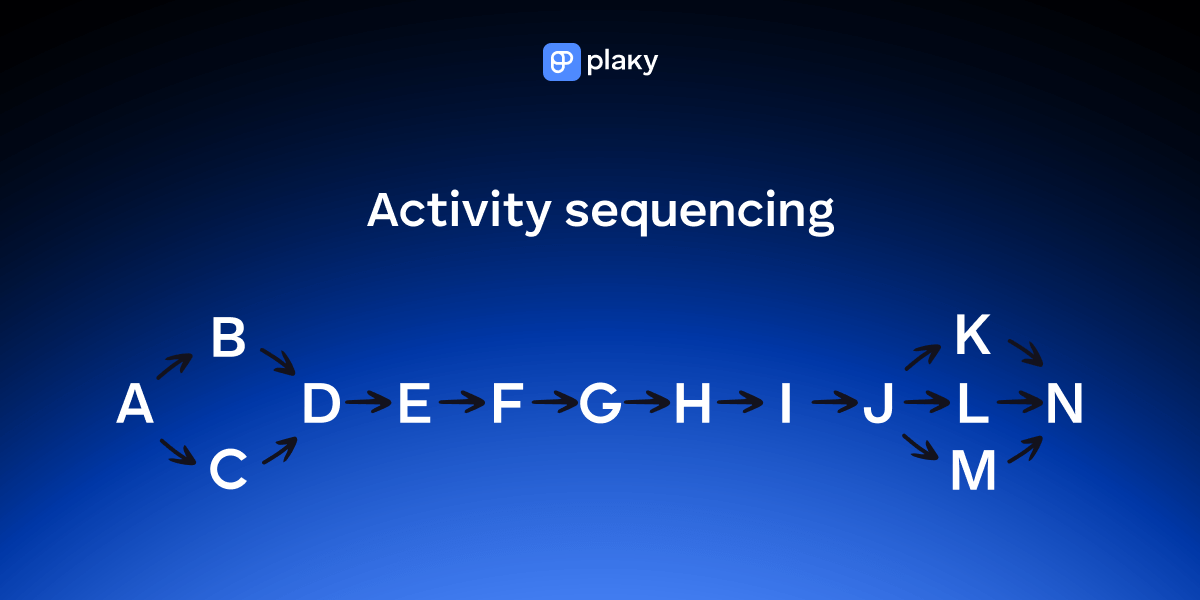
According to Jan Schiller, the project’s activity sequence should be well thought out:
“Sequence the tasks to logically reflect reality. What tasks must be completed before others can begin? What tasks must wait for another task to complete? What tasks must start at the same time, or finish at the same time? When a resource is fully allocated to the tasks, reflect the fact that a resource can only work on one thing at a time by sequencing accordingly.”
#4 Draw the network diagram
Once you’ve reached step 4, you can use all the collected information to create the type of diagram that suits your needs.
Whether you use project management software or draw it by hand, remember the following:
- Your diagram should have only 1 start and 1 end point.
- The symbols you use should be universally comprehensible and consistent.
- If you use some other symbols, make sure to define them properly in a diagram legend.
- Use straight arrows and try not to overlap them.
- Don’t overpopulate your ADM diagrams with dummy activities.
- Keep it simple — the diagram should be easy to understand at a glance.
Based on the example above, here’s what the ADM diagram looks like:
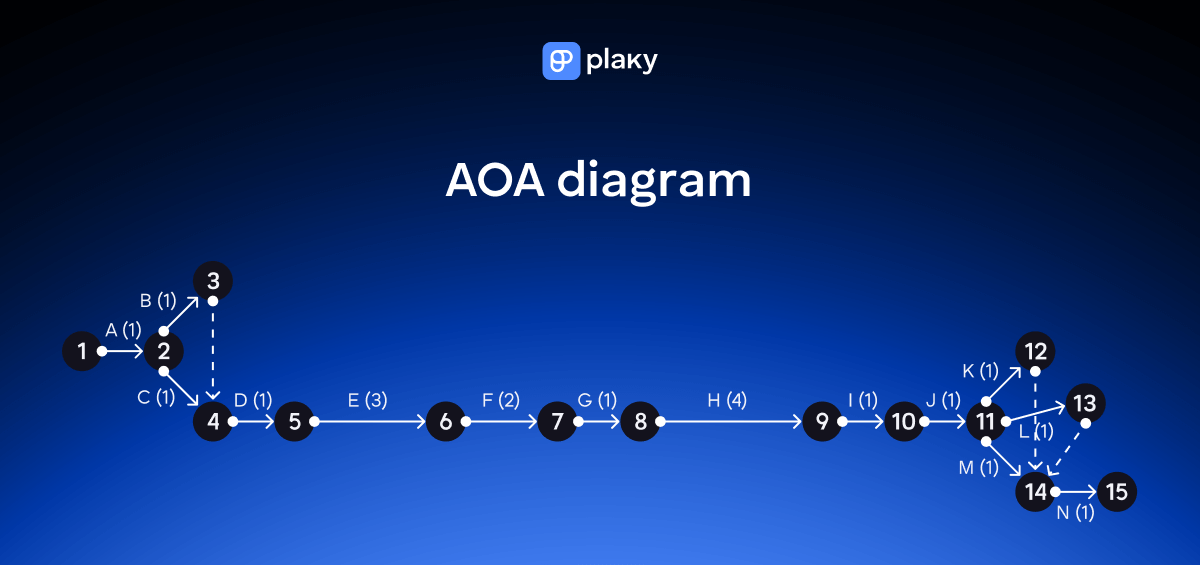
This type of diagram is not used so much these days, so you’re more likely to make a PDM diagram for your projects, especially if you want to find the project’s critical path.
Here’s what the PDM diagram for this example looks like:
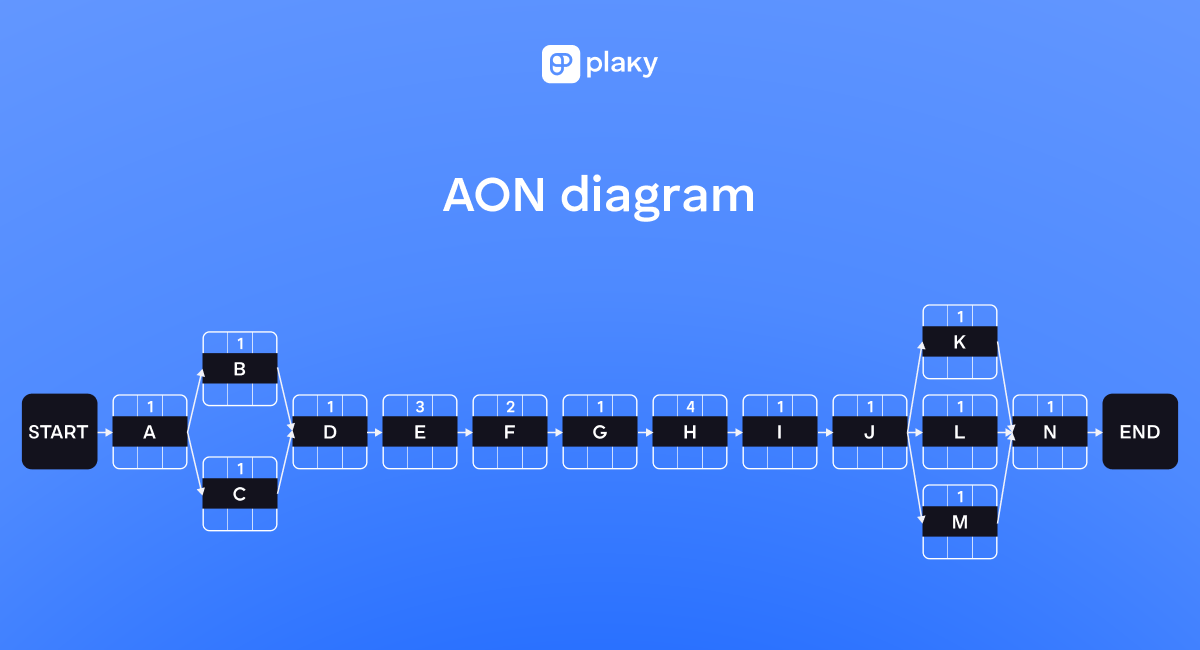
You can see the nodes in this diagram are split into 7 panels. Since PDM diagrams are used in the critical path method, you can fill in the blanks with other activity values, such as:
- Early start and finish times,
- Late start and finish times, and
- Total float.
Since some activities have multiple predecessors or successors, the diagram must illustrate that via path divergence or path convergence.
Path divergence happens when an activity has more than one successor, while path convergence is when an activity has more than one predecessor.
💡 Plaky Pro Tip
Want to learn about the origin of critical chain project management, its pros and cons, and how it differs from CPM? Check out the following guide:
#5 Review and update the diagram with current data
Once the diagram is set up, make sure it’s easy to understand and keep updating it regularly.
Apart from using a project management tool to create the diagram, Jan Schiller recommends adding a summary view as well:
“Support project communication with a summary view of the project network diagram. This will help project teams and executives alike to understand the way the work must flow to achieve the project’s result.”
However, if the diagram is already too big and seems disorganized, she believes it might be a good idea to switch tools:
“Switch to a Gantt chart visual when the project network diagram becomes too large and unwieldy. A project network diagram does not replace the need for a Gantt chart (which visually places the tasks in the context of a timeline).”
Jan also emphasizes the importance of relying on accurate planning data when making the diagram:
“The project network diagram is a critical prerequisite to determining a project’s schedule (and therefore, project costs). [But] the project network diagram is only as good as the planning data the diagram is visually representing: a complete list of tasks that are accurately estimated and sequenced properly.”
To ensure the diagram’s accuracy and general usefulness, Jan’s advice is simple but precise:
“Develop the initial project network diagram thoughtfully. Keep this data current throughout the life of your project.”
Benefits of using a project network diagram
Some of the major benefits of using a project network diagram are that it:
- Defines and streamlines the project workflow, identifying all the activities that should be done and the sequence they should follow,
- Visually communicates key project data, such as critical activities and dependencies, helping the project manager better understand the workflow and pinpoint errors and potential bottlenecks,
- Helps identify and resolve project issues,
- Enables easier project planning and simplifies scheduling,
- Allows for more methodical resource allocation,
- Improves the team’s understanding of the project scope and everything they must do to meet the project goals,
- Boosts the project team’s efficiency, productivity, and performance, and
- Gives the team a deeper insight into their responsibilities and level of contribution.
When asked about the benefits of project network diagrams, Jan Schiller highlighted conflict and issue identification:
“Any scheduling conflicts or issues are identified proactively when there is adequate project runway to address and resolve those issues to ensure a predictable schedule.”
She also reflected on the use of visual aids to support better communication and manage project stakeholder expectations:
“Because visual representations of project information are easier to understand than a view of all of the source data, project communications, and project expectation management become easier.”
💡 Plaky Pro Tip
What role does communication play in project management and how can you improve it to support your project’s success? Read all about it and get useful tips in the guide below:
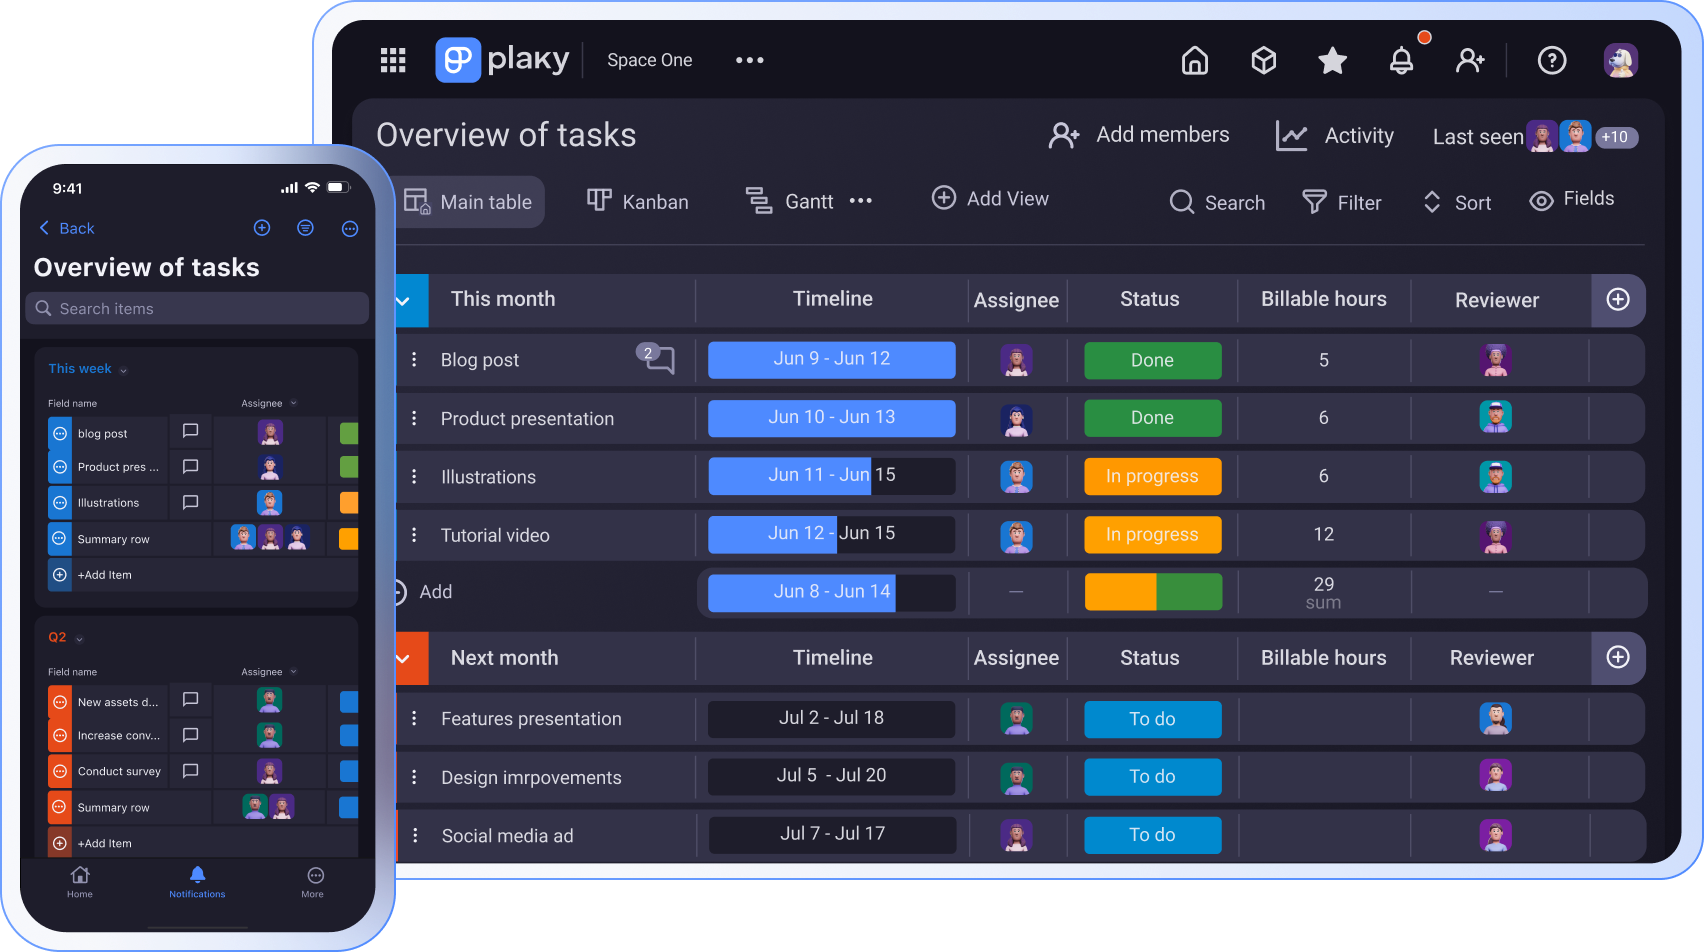
Organize all your project activities with Plaky
You can manage complex projects more easily with Plaky by centralizing and visualizing your activities.
Each of your projects can have its own board where you can invite only the teams that are working on it and the interested stakeholders. This way, team members won’t be spammed by information that doesn’t relate to their work.

Every activity can be identified and defined through items where you can:
- Add a detailed description to ensure the next steps are clear to everyone,
- Communicate with your team and share quick updates through comments, and
- Share and save task-related files.
Plaky’s activity log also keeps everyone in the loop and makes sure the whole team is aware of how the project is developing at all times.

We mentioned you should define how long each task will take and who’s responsible for it. In Plaky, you can define all these parameters with customized fields and see at a glance if a task is overdue and who to contact.
And if you need help in starting out, you can use one of the many available project management templates to save time and kick off your project right away!

Overall, creating project network diagrams comes easy when all your project activities are properly organized with project management software.
So what are you waiting for?
Breaking down a project into more manageable pieces or creating detailed activity lists? Plaky’s got you covered. Sign up for a free 14-day trial today!
How we reviewed this post: Our writers & editors monitor the posts and update them when new information becomes available, to keep them fresh and relevant.