 Updated: March 5, 2026
 Have you ever wondered how many projects are actually successful — and what distinguishes them from those that fail?
Or, you might be interested in how much project managers earn across the world (maybe it’s time to ask for a raise?).
There’s a lot of project management statistics out there, but we’ve combed through them and selected the most important information for you.
So, read on!

Key project management statistics
To give you a taste of what’s to come, here are some of the most interesting and important project management statistics you should know about the state of project management:
- There are 40 million project professionals today, and there could be up to 70 million by 2035.
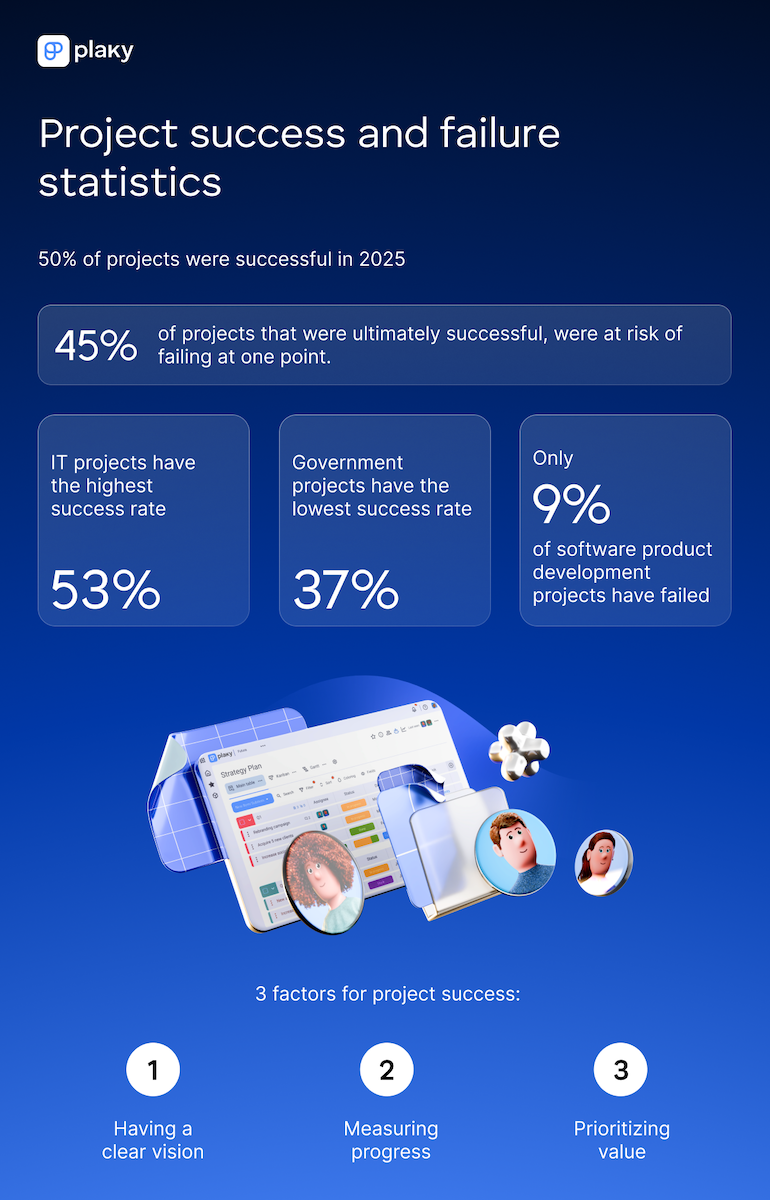
- 50% of projects were successful in 2025.
- Project managers earned on average $92,000 in 2025.
- The number of project management professionals working remotely rose by 11%.
- There are over 1.5 million PMP certificate holders worldwide.
- Only 42% of managers and 39% of senior managers or directors are women.
- 54% of project managers use AI for risk management.
- 65% of project management software users use reports/dashboards feature, making it the most popular PM tool feature.
Project manager statistics for 2026
Here are the most recent statistics when it comes to project managers.
Manager engagement rate dropped from 30% to 27%
According to Gallup’s “State of the Global Workplace 2025”, management engagement rate fell by 3% in 2024, with young and female managers experiencing the biggest drop:
- Young (under 35) manager engagement declined by 5%.
- Female manager engagement fell by 7%.
This decline in manager engagement is paramount since it directly affects team engagement — 70% of team engagement is related to the management according to Gallup’s research “Who’s Responsible for Employee Engagement”.
Only 44% of managers across the world say they have received management training
Gallup’s “State of the Global Workspace 2025” research shows that less than half of managers receive management training. However, the numbers also indicate how significant training is:
- When they receive management training, managers’ thriving levels rise from 28% to 34%.
- When they receive training and someone at work actively encourages their development, the number increases to 50%.
- If the training is focused on management best practices, the participants have up to 22% higher engagement rate than non-participants and teams led by them have 18% higher engagement.
35% of US workers stated they had endured poor or ineffective management
According to the “2025 SHRM State of the Workplace” report, over a third of US workers reported experiencing poor or ineffective management.
Moreover, 42% of them thought their organization was effective or very effective at leadership and manager development. In contrast, only 37% of HR professionals felt the same.
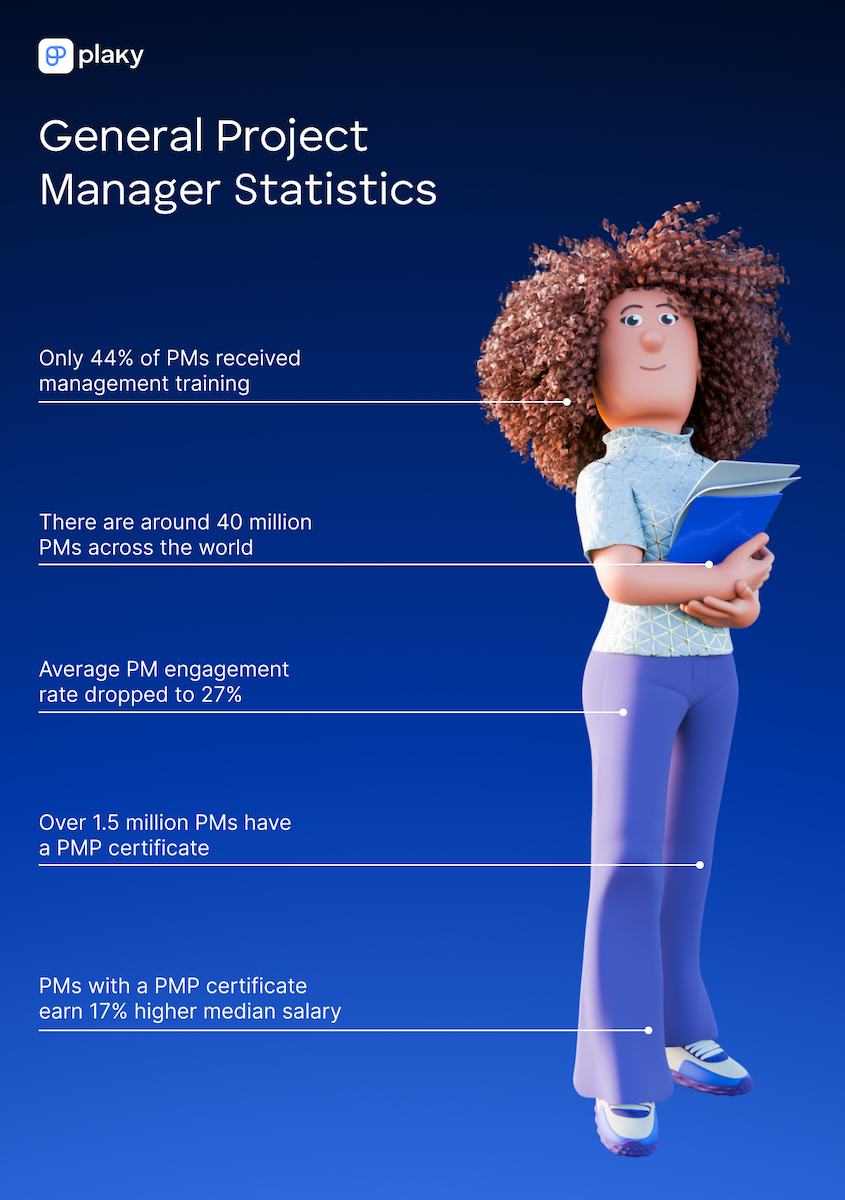
There are around 40 million project professionals today, and by 2035, we could need up to 30 million more
According to PMI’s “Global Project Management Talent Gap”, there are around 40 million project professionals. This is quite a high figure, when you compare it to 25 million software developers or 30 million nurses worldwide.
However, the numbers are only expected to rise — it is projected that the world will need another 30 million project professionals by 2035.
China is projected to have the biggest talent gap — a whopping 10.4–13.6 million additional project management professionals will be needed. North America, on the other hand, is in 6th place with a 1.3–1.6 million gap.
Projected talent gap by 2035 across regions:
| Region | Talent gap (expressed in millions) |
|---|---|
| North America | 1.3–1.6 |
| Europe | 2.9–3.5 |
| Middle East/North Africa | 0.5–0.6 |
| South Asia | 3.4–4.4 |
| Latin America | 0.6–0.8 |
| Sub-Saharan Africa | 1.6–2.1 |
| China | 10.4–13.6 |
| Asia-Pacific | 2.6–3.2 |
Source: PMI, “Global Project Management Talent Gap”
Over 1.5 million people worldwide hold a PMP certificate
PMP, a globally acknowledged certification issued by the Project Management Institute (PMI), was held by as many as 1,584,620 in 2024, according to the HQ Hire’s “Number Of PMP Holders By Country In 2025” report.
There are 211 countries that have at least 1 PMP holder. However, more than half of them come from China (36.62% or 580,360 holders) and the US (26.53% or 420,330 holders). There’s a big gap between these 2 countries and those that follow:
| Country | % of total PMP holders | PMP holders |
|---|---|---|
| China | 36.62% | 580,360 |
| US | 26.53% | 420,330 |
| Canada | 5.83% | 92,386 |
| India | 4.55% | 72,045 |
| Japan | 2.88% | 45,649 |
| Saudi Arabia | 2.61% | 41,325 |
| Germany | 1.19% | 18,792 |
| United Arab Emirates | 1.15% | 18,253 |
| Brazil | 1.01% | 16,041 |
| Singapore | 0.98% | 15,557 |
Source: HQ Hire, “Number Of PMP Holders By Country In 2025”
Interestingly, even though Singapore is only the 10th when it comes to total number of PMP holders, it comes first when we take into account the population of the country. Singapore has the highest number of PMP certified experts per million — 2,586. It’s followed by Canada, Qatar and Hong Kong.
Project management software statistics for 2026
Check out the current project management trends when it comes to PM software.
Only 1 in 3 software buyers adopts software successfully
Capterra’s “2026 Software Buying Trends Report: The 5 Habits of Successful Software Adopters” shows that more often than not software purchases aren’t successful, as 2 out of 3 software buyers are unsuccessful adopters.
Those that are successful, however, share some important habits:
- They turn to product reviews and industry advice rather than generative AI.
- They choose the software within 3 months.
- Over a half of them create an implementation plan to reduce the risk of disruptions.

Disappointed software buyers have a higher chance to overspend on PM software
The same research shows that those who aren’t satisfied with their purchase plan to spend more on project management software in 2026:
| Amount they plan to spend in 2026 (compared to 2025) | Disappointed buyers | Successful software adopters |
|---|---|---|
| Much more (more than 15% increase) | 25% | 12% |
| Somewhat more (5-15% increase) | 57% | 58% |
| The same amount (less than 5% difference) | 15% | 26% |
| Somewhat less (5–15% decrease) | 3% | 3% |
| Much less (more than 15% decrease) | 1% | 1% |
Source: Capterra’s “2026 Software Buying Trends Report: The 5 Habits of Successful Software Adopters”
The most popular feature in a PM tool is the report/dashboard feature
According to Capterra’s “Project Management Software Market Research Report”, the feature users utilize the most in a PM tool are reports/dashboards — 65% of users report using it.
Here’s the breakdown of PM software features according how many users actually use it:
| Feature | Used by % of users who have access to it |
|---|---|
| Reports/dashboards | 65% |
| Document management | 64% |
| Collaboration | 60% |
| Requirements management | 57% |
| Budgeting | 55% |
| Resource planning | 54% |
| Time tracking | 53% |
Source: Capterra, “Project Management Software Market Research Report”
More than a third of users don’t use velocity, Gantt, or burndown charts
Capterra’s research report shows that around 1 in 3 PM software users don’t utilize velocity charts, Gantt charts, or burndown charts, even though they have access to it.
Here’s the list of features PM software users don’t use:
| Feature | Not used by % of users who have access to it |
|---|---|
| Velocity charts | 34% |
| Gantt charts | 34% |
| Burndown charts | 34% |
| Risk management | 32% |
| Kanban boards | 30% |
| Project request intake form | 29% |
| Product roadmapping | 28% |
Source: Capterra, “Project Management Software Market Research Report”
1 in 5 PM software users wants to have Gantt and burndown charts and automated workflows
Interestingly, the same report shows that when talking about features they don’t have, but want, 22% of PM tool users said they wanted a Gantt chart, and 21% said they wish they had a burndown chart.
The features PM users want the most are:
| Feature | % of users who want the feature but don’t have it |
|---|---|
| Gantt charts | 22% |
| Burndown charts | 21% |
| Automated workflows | 20% |
| Velocity charts | 20% |
| Portfolio management | 19% |
| Product roadmapping | 19% |
| Project request intake form | 19% |
Source: Capterra, “Project Management Software Market Research Report”
The global PM software market is projected to reach $20.47 billion by 2030
The project management software market in 2022 was estimated at $6.59 billion according to Grand View Research’s report. However, it’s expected that this number will grow at a 15.7% CAGR (Compound Annual Growth Rate) and reach over $20 billion by 2030.
North America is the biggest market with 47% of the overall PM software market in 2022. The Asia and Pacific area, on the other hand, is the fastest growing market.
AI project management trends for 2026
AI has had a huge impact on the state of the workplace in general. So, let’s see how it influences the project management industry.
55% of PM software buyers say adding AI was the main reason for their most recent purchase
According to Capterra’s “2025 Project Management Software Trends Survey”, over a half of the PM software buyers cite adding AI as the top reason behind their most recent purchase.
Moreover, Capterra’s “2024 Most Impactful Project Management Tools Survey” shows that almost a half of project managers utilize AI as a part of their project management software. On top of that, 36% of them plan to increase their AI investments in the future.
Still, around a half of project managers expressed skepticism toward AI.
More than half of project managers use AI for risk management
According to Capterra’s “Most Impactful Project Management Tool Survey”, 54% of surveyed managers use AI for risk management, which makes it a top use case for AI, closely followed by task automation.
Here’s the list of most common uses for AI in project management:
| Use case | % of managers using it |
|---|---|
| Project risk management | 54% |
| Task automation | 53% |
| Predictive analysis/forecasting | 52% |
| Scheduling optimization | 52% |
| Resource planning and allocation | 47% |
Source: Capterra, “2024 Most Impactful Project Management Tool Survey”
Most project managers grade their AI investments as successful
The same survey by Capterra analyzed the success rates of project managers’ AI investment and found:
- 90% of project managers report positive ROI on their AI investment in the last 12 months.
- 63% of project managers report increased productivity and efficiency as a top benefit of AI.
- 88% of project managers claim they are comfortable with delegating important tasks to AI.
- 94% of project managers feel confident they can successfully lead an AI-implementation project.
Remote work statistics for 2026
Here are top project management industry statistics for remote work.
Project management is the field with the most remote jobs
According to the Remote Work Index by FlexJobs, project management has the highest number of remote workers in the final quarter of 2025, followed by computer and IT and Sales field.
If we divide these remote workers according to their seniority, we find that there are:
- 67% of experienced jobs,
- 19% of managers,
- 9% of senior managers, and
- 6% of entry-level jobs.
The number of remote project management jobs rose by 11%
The FlexJobs’ research shows that in the final quarter of 2025 alone, there has been a spike in remote project management jobs by 11%, significantly more compared to the 3% increase in remote jobs in general.
This is interesting, considering the PMI’s “Pulse of the Profession 2024” report found there was a decline in project managers working remotely between 2021 and 2023. Their research showed only 61% of project workers were working at least 1 day a week remotely in 2023, as compared to 89% in 2021.
Only a quarter of senior leaders perceive remote work as effective
The “Pulse of the Profession 2024” report shows that the perceived effectiveness of remote work is much lower in the eyes of senior leaders than project managers:
- 33% of project managers feel that remote work is as effective as in-person work.
- Only 25% of senior leaders feel that remote work is as effective as in-person work.
However, If we look at the statistics on project management performance across the 3 types of work practices (remote, hybrid, and in-person), we see that the differences are marginal:
| Work location | Project performance rate |
|---|---|
| Fully remote | 73.2% |
| Hybrid | 73.4% |
| In-person | 74.6% |
Source: PMI “Pulse of Profession 2024”
💡 Plaky Pro Tip
Discover other interesting remote work statistics in this article:
Statistics on Project Management Offices (PMOs)
Let’s take a look at the most important project management stats when it comes to PMOs.
Most organizations have 1 or more PMOs
According to the 2024 Wellingtone report, as many as 82% of organizations have at least one PMO. On top of that, roughly 1 in every 4 PMOs had been opened in the 2 years prior to the release of this report.
The report also shows that:
- 38% of PMOs plan to increase in size, compared to 57% from the year prior.
- 57% of PMOs plan to increase in scope and responsibilities. This represents a sizable downgrade compared to the previous year’s 72%.
89% of organizations in the financial services sector have some form of PMO
According to PMI’s “Built to Thrive: PMOs That Elevate Innovation and Power Transformation” report, PMOs have the most presence in financial services, followed by aerospace and telecom:
| Sector | Proportion of organizations in each sector that have some form of PMO |
|---|---|
| Financial services | 89% |
| Aerospace | 82% |
| Telecom | 80% |
| Energy | 76% |
| Consulting | 73% |
| Pharmaceutical | 73% |
Source: PMI’s “Build to Thrive” report
The only 2 industries that have PMO presence lower than 50% are mining (48%) and construction (47%).
Meanwhile, the most high-performing PMOs are found within the consulting sector, with a whopping 74% of respondents from this report rating their organization’s PMOs as high-performing. This is followed by the energy and information technology sectors at 61% and 56% respectively.
Organizations with high-performing PMOs are 13% more likely to use PM software
PMI’s “Built to Thrive” report shows there’s a striking correlation between high-performing PMOs and the usage of different technologies for managing project work.
Companies with high-performing PMOs are 13% more likely to use project management software, but also:
- 7% more likely to use document management software,
- 6% more likely to use collaboration software,
- 7% more likely to use budgeting and financial tools,
- 20% more likely to use analytics and reporting tools,
- 12% more likely to use enterprise resource planning software,
- 15% more likely to use portfolio management software,
- 16% more likely to use product development software, and
- 10% more likely to use low-code/no-code platforms.
Skyrocket your performance with Plaky
Organizations with high-performing PMOs have 29% higher ability to deliver value to customers
PMI’s report on PMOs also highlights the biggest benefits organizations reap from having high-performing PMOs, namely the improved ability to:
- Deliver value to customers (80% compared to 51% of non-high-performing PMOs),
- Quickly reprioritize (47% compared to 36%),
- Empower people/teams (73% compared to just 31%),
- Learn and share knowledge (72% vs just 30%), and
- Clearly communicate strategy (67% compared to 25%).
Another benefit is the higher commitment to continuous improvement in general (71% compared to only 23%).
Statistics on women in project management for 2026
Let’s look more closely at the position of women in the project management industry.
There are 3 times as many men in project management as there are women
PMI’s “The State of Women in Project Management 2023” report shows there are 3 male managers for each female manager.
The gender distribution discrepancy among project workers is smallest in healthcare (41% to 59%) and largest in construction (13% to 86%).
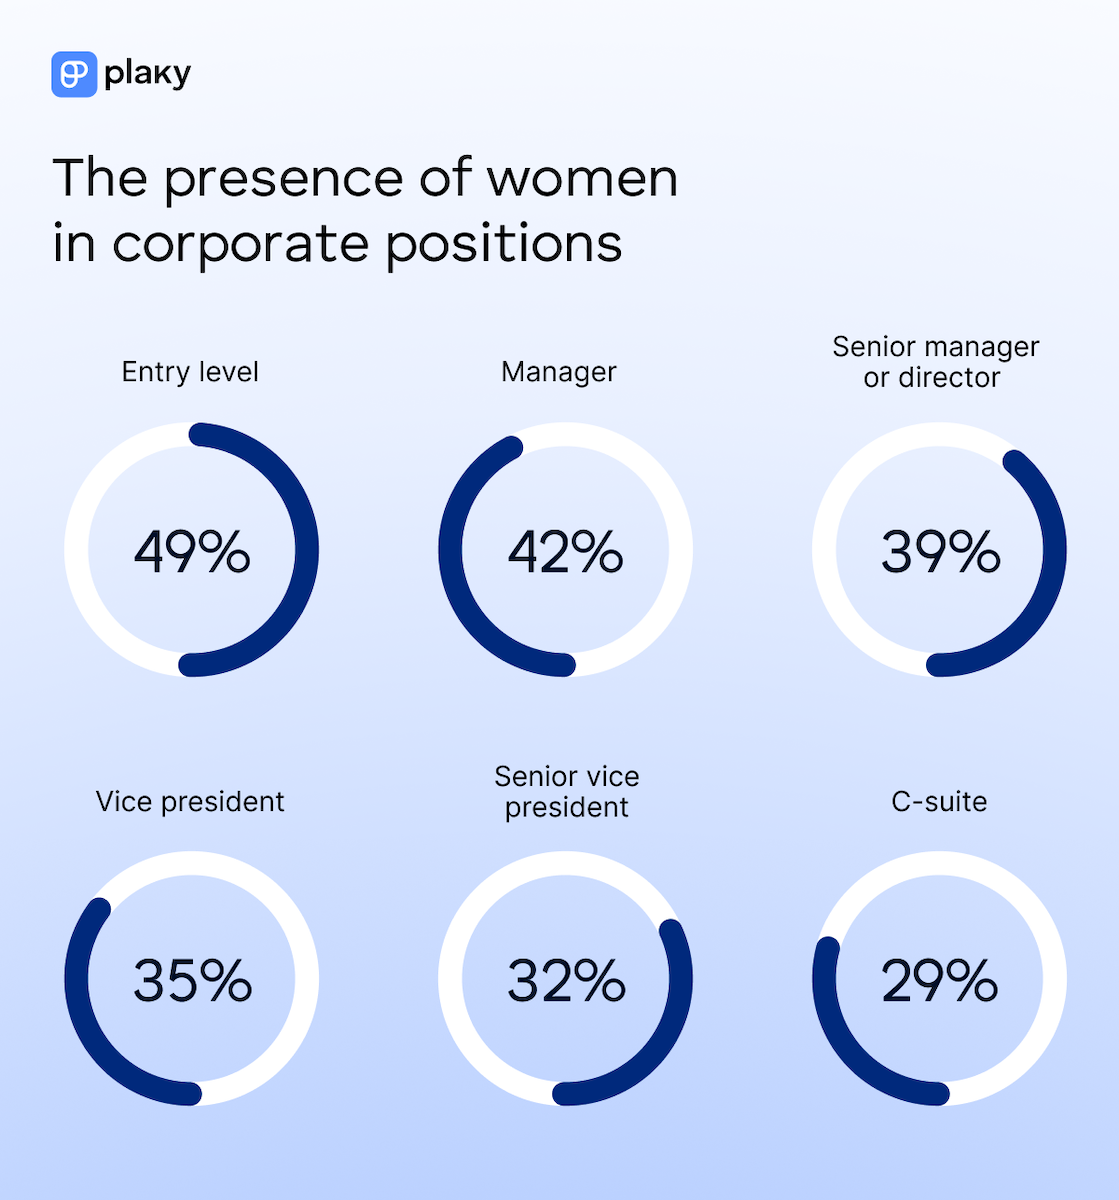
42% of managers and 39% of senior managers or directors are women
The McKinsey’s “Women in the Workplace 2025” report shows that men outnumber women in all corporate positions, with the number of women decreasing as the positions get higher:
- Entry level: 49%,
- Manager: 42%,
- Senior manager or director: 39%,
- Vice president: 35%,
- Senior vice president: 32%, and
- C-suite: 29%.
69% of entry-level women in project management want a promotion compared to 80% of entry-level men
The “Women in the Workplace 2025” report also found that the percentage of entry-level men and women who express their career is important to them is roughly the same (89% compared to 88% respectively).
However, the desire for promotion is present with only 69% of women compared to 80% of men.
On average, women receive 30% wage premium between job zones, compared to men’s 44%
The data from “2025 Future of Jobs Report” from World Economics Forum shows that, on average, male workers receive 44% wage premiums when transitioning positions in the workplace while female workers receive only 30% for the same change.
The difference, however, is larger at specific transitions. For example, men receive a 39% wage premium when they move from jobs that require little preparation to jobs that require some preparation (according to O*NET job zones based on level of education, related experience, and job training), whereas women receive only 19%.
An even bigger difference is with more complex jobs — women receive 15% higher wage for transitioning from jobs that require considerable preparation to jobs that require extensive preparation. Men, on the other hand, receive 44% higher wages for the same transition.
💡 Plaky Pro Tip
Discover how domestic work is divided among genders in the following report:
Project success and failure statistics
Here are the most important project success rates and the reasons behind them.
50% of projects in 2025 were successful
PMI’s 2025 Project Success report, “Step Up: Redefining the Path to Project Success With M.O.R.E.”, shows that a half of projects were successful globally. The other half was graded as a:
- Mix of failure and success (37%) and
- Failure (13%).
There’s a slight rise compared to 2024, when 48% of projects were successful, while failure rate was 12%.
PMI points out 3 fundamental factors for project success:
- Having a clear vision — A clear vision of success gives you a +41 Net Project Success Score (NPSS)*, compared to -18 when there’s no clear vision.
- Measuring progress — Measuring progress has 3 aspects: defining success criteria, having an established measurements system, and measuring progress toward intended outcomes. When all 3 are applied, the project NPSS is +54, compared to +31 when only 1 of these is skipped.
- Prioritizing value — Teams willing to flex project constraints to prioritize value have NPSS of +60, while those aren’t willing have +42.
*Net Project Success Score — a PMI metric that has a comprehensive view of project success and evaluates projects on a continuum of success, instead of relying on a binary system (success/failure).
Almost a half of successful projects were at risk of failure
A staggering 45% of projects that were ultimately successful were at risk of failing at one point.
PMI singled out the 4 most effective interventions when a project is at risk of failure:
- Adapt to changes in external conditions (+34 NPSS),
- Communicate project challenges to stakeholders (+29 NPSS),
- Bring in additional resources (+17 NPSS), and
- Revisit project timeline (+11 NPSS).
Ensure projects success with Plaky
The industry with the highest failure rate is the government sector
PMI has merged data from 2024 and 2025 to give a more comprehensive dissection of project success/failure rates according to industry. The results show that the leading industry when it comes to project failure is the government sector, with IT and healthcare being the most successful sectors.
Here’s a more detailed breakdown:
| Industry | Failure | Mixed | Success |
|---|---|---|---|
| IT | 10% | 37% | 53% |
| Healthcare | 11% | 38% | 52% |
| Industrials | 12% | 35% | 53% |
| Finance | 12% | 37% | 52% |
| Construction | 10% | 39% | 51% |
| Communication services | 14% | 37% | 49% |
| Energy and utilities | 12% | 44% | 44% |
| Consumer discretionary and staples | 13% | 43% | 44% |
| Consulting | 13% | 42% | 45% |
| Government | 25% | 38% | 37% |
Source: PMI, “Step Up: Redefining the Path to Project Success With M.O.R.E.”
Software product development projects have the highest percentage of success
When it comes to project types, software product development projects were successful 54% of time, while projects handling functional lines of business managed the same only 40% of time.
| Project type | Failure | Mixed | Success |
|---|---|---|---|
| Software product development projects | 9% | 37% | 54% |
| IT implementation and upgrade projects | 10% | 36% | 53% |
| Physical infrastructure projects | 11% | 37% | 52% |
| Non-IT product development projects | 13% | 38% | 49% |
| Functional line of business projects | 15% | 45% | 40% |
Source: PMI, “Step Up: Redefining the Path to Project Success With M.O.R.E.”
Projects funded by non-profit or non-governmental organizations have the highest success rate
If we look at funding source as a distinguishing factor, PMI’s research shows that non-governmental projects are most successful, while domestic government-led projects have the lowest success rate:
| Funding source | Failure | Mixed | Success |
|---|---|---|---|
| Non-profit/non-governmental organization | 14% | 17% | 69% |
| External funding from bank or for-profit investors | 10% | 33% | 57% |
| International institution or foreign government | 14% | 31% | 55% |
| External funding from a client or customer | 11% | 39% | 50% |
| Internal budget (from within your organization) | 10% | 41% | 49% |
| Domestic government | 13% | 48% | 39% |
Source: PMI, “Step Up: Redefining the Path to Project Success With M.O.R.E.”
Project management salary statistics in 2026
Let’s explore how much people working in project management earn across the world, industries, and levels of seniority.
Median salary for project managers in 2025 was approximately $92,000 globally
According to APMIC’s “Global Project Management Salary Report 2025”, the global median salary in 2025 has increased by 6.3% in comparison to 2024, but still remains just under $100,000.
However, the situation is not the same everywhere — salaries depend on the state of the economy, cost-of-living adjustments, industry, currency stability, and many other factors.
A major difference exists between entry-level and senior-level positions — entry-level project managers earn between $55,000 and $70,000 annually, while someone at a senior position earns between $110,000 and $150,000.
North America has the highest median salaries that can exceed $130,000 annually
APMIC’s report also shows that salaries vary across the world with North American technology hubs like San Francisco, Seattle, and Toronto boasting the highest pays reaching up to $130,000.
In Southern Europe, on the other hand, the annual pay is half of that, balancing between $55,000 and $75,000. This is influenced by smaller project budgets across industries as well as lower cost of living.
Here’s an overview of annual salaries across regions:
| Region | Annual salary |
|---|---|
| North America | Exceeding $130,000 for senior-level roles in top metro areas |
| Western Europe | $90,000–115,000 for experienced project managers |
| Southern Europe | $55,000–75,000 |
| Asia-Pacific region (Singapore, Australia, and Japan) | $85,000–100,000 for certified senior professionals |
Source: APMIC, “Global Project Management Salary Report 2025”
IT and tech industry lead with annual salaries that reach up to $140,000
When it comes to salaries across industries, APMIC’s report points out that project managers working in the IT and technology sector have the highest pay. They also receive various benefits such as signing bonuses or flexible remote arrangements that help companies hire top talent.
Here’s how annual salaries vary across industries:
| Industry | Annual salary |
|---|---|
| IT and technology | $120,000–140,000 (senior roles in mature markets) |
| Construction and manufacturing | $95,000–120,000(in developed markets) |
| Healthcare | $100,000–115,000 (in developed markets) |
| Finance | $100,000–115,000 (in developed markets) |
Source: APMIC, “Global Project Management Salary Report 2025”
Certifications make a big difference when it comes to salary
Project managers can improve their financial income significantly, by acquiring a relevant certification.
The APMIC’s report shows that Agile Certified Practitioner (PMI-ACP) holders, on average, earn 12–15% more than their non-certified peers in software and product development.
Moreover, APMIC certification can get you, on average, 12–18% bigger salary than that of your non-certified peers with similar experience.
When it comes to exact paychecks, here’s what holders of most popular certifications earn:
- Project Management Professional (PMP): $120,000–135,000 in developed markets,
- PRINCE2: $100,000–115,000 for senior professionals,
- Certified Associate in Project Management (CAPM): $65,000–80,000 in developed economies, and
- Lean Six Sigma Black Belt: more than $130,000 for experienced leaders.
Ensure you’re part of the project success statistics with Plaky by CAKE.com
Statistics can help you understand project management, but it won’t help you actually manage your projects.
Luckily, Plaky by CAKE.com will!
Try Plaky by CAKE.com for free
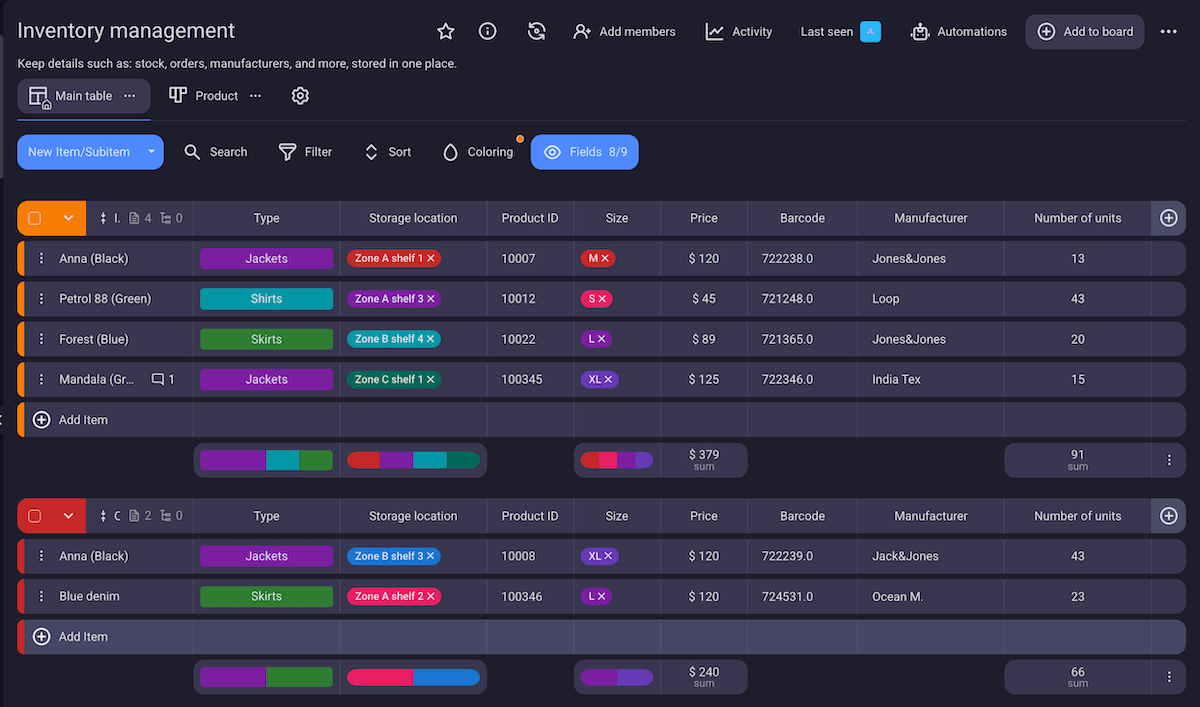
Plaky is a robust, yet user-friendly project management platform that can help you:
- Organize tasks into clear and functional Boards.
- Keep an eye on project progress on a Gantt chart.
- Have an overview of all your tasks across different projects with My tasks view.
- Track various types of information with custom Fields.
- Automate manual and repetitive tasks with Board automations.
- Stay up-to-date with all changes with real-time Notifications.
Besides advanced project and task management features, Plaky also offers 24/7 customer support that consists of real people. There’s no annoying back-and-forth with AI chatbots that don’t understand your problem — Plaky’s customer agents are available for a chat, phone call, or email correspondence whenever you want.
And best of all? Plaky is affordable! You can choose between 3 pricing plans:
- Free forever plan — unlimited users/boards/items/views, My tasks, Chart view, Summary row, etc.
- Pro Plan ($3.99/user/month) — private boards and spaces, Gantt view, automations, bulk actions, etc., and
- Enterprise plan ($8.99/user/month) — board permissions, unlimited activity log, custom subdomain, SSO, etc.
Launch your projects successfully every time — go for Plaky by CAKE.com!
How we reviewed this post: Our writers & editors monitor the posts and update them when new information becomes available, to keep them fresh and relevant.