 Published: October 22, 2024
 How do you know whether a project is successful and on track? Project management metrics answer this question accurately based on pure data.
Playing the guessing game with stakeholders, their budget, and your teams’ time is not an option nowadays. With a vast choice of software, recording and analyzing numbers today is much easier than in previous decades.
So why would you miss out on the opportunity to present your project’s progress with confidence? There’s no need to use too many project metrics either — only the ones relevant to the project at hand.
Discover what project management metrics are, their many types, and how to measure them.

- Project management metrics measure the project’s performance and progress.
- By regularly tracking metrics, project managers can take corrective action on time to prevent project failure.
- There are 4 vital groups of metrics every manager should track.
- Every industry has specific metrics that don’t necessarily apply to every project.
What are project metrics?
Project metrics are numerical indicators that show the project’s performance and progress.
Project managers use formulas and calculations to read data sets and check the status of various team activities.
Why are project metrics important?
As a project manager, you can rely on project management metrics to help you:
- Keep current projects on track,
- Learn from your past mistakes, and
- Set expectations for upcoming projects.
Ongoing projects rely heavily on accurate real-time data, which can be hard to obtain. Data collected in real time gives an insight into the project’s performance. What’s more, it’s vital for risk management — if the numbers are available on time, project managers can spot early signs of project failure and take corrective action.
That said, once you complete a project, you shouldn’t overlook or forget its results. Instead, try to analyze historical data regularly and use it as a measure of success — or a cautionary tale.
This data should show you where and why your estimates were wrong, which resources you failed to use properly, and which costs blew out of proportion. As a result, you will be able to make better plans for the future and showcase your success in the form of data too.
Essentially, when information is properly collected and analyzed, project managers can get increasingly better at planning with each passing project.
Types of project metrics
There are dozens of project metrics you can use to measure your project’s performance. The data and the metrics managers rely on will depend on the industry they’re in and the results their stakeholders find important.
There isn’t an official classification of metrics used in project management, but these are the 4 vital groups of project performance metrics every manager should monitor:
- Scope metrics,
- Cost metrics,
- Schedule metrics, and
- Quality metrics.
Scope metrics
In project management, scope is one of the most important elements of a project since it defines the project goal, deadlines, and deliverables.
The longer and more complex the project is, the more likely its scope will change, leading to scope creep.
The best way to avoid scope creep is to define the project scope as precisely as possible before the project’s start date. So, together with the project stakeholders and your team, you should come up with a clear outline of the project’s:
But defining the scope isn’t enough to preserve it. Project managers have to keep checking whether the 4 parameters listed above are properly tracked throughout the project.
Track project scope metrics in Plaky
Cost metrics
Costs are directly related to a project’s budget, so project managers must control them at all times.
The importance of cost control is also reflected in the number of indicators that help track planned and actual costs.
The main cost metrics are:
- Earned value,
- Cost variance, and
- Cost performance index.
Earned value (EV)
Earned value is the value of the work performed up until a certain point in the project. The formula to calculate earned value is:
EV = % of work completed x total project budget
This indicator shows whether the achieved value matches the planned value or not. The formula can be used at any point during project development to assess if it’s going according to plan.
Let’s see an example.
Suppose a family hired contractors to redo the floors of 2 rooms. The budget is $1,000, and the estimated time to complete the project is 3 days.
At the end of day 2, the floors have been stripped and varnished twice, meaning that 1 more coat is left to apply. Applying each coat of varnish makes up 20% of the entire project, so in total, 80% of the work has been completed.
We can now apply the formula to check the project’s current earned value.
EV = 80% x $1,000 = $800
💡 Plaky Pro Tip
Earned value is the key to earned value management, a methodology that enhances project performance. Learn more about EVM in our guide:
Cost variance (CV)
Cost variance is a parameter that shows the difference between the planned and the actual cost (AC) at any point in the project.
To calculate it, you’ll first need to calculate the earned value.
CV = EV – AC
CV = % of work completed x total project budget – AC
If the result is over zero, there’s a positive cost variance, meaning your costs are under the planned budget.
On the other hand, a negative cost variance shows you’re overspending and should bring your expenses under control.
In our flooring example, the project is going according to plan. Here’s how we can calculate the cost variance:
CV = $800 – $600 = $200
The positive value shows us the project is under budget by $200.
Cost Performance Index (CPI)
The cost performance index shows how cost-efficient the project is. It requires the same values as cost variance, but it’s calculated slightly differently:
CPI = EV / AC
CPI = % of work completed x total project budget / AC
If the result is:
- Over 1 — the project is under budget.
- Equal to 1 — everything is going according to plan.
Project managers should be concerned and react if CPI is under 1. This result indicates the project is over budget.
Though we’ve already established in our example that the project is under budget, we can still apply the formula:
CPI = $800 / $600 = 1.33
As you can see, CPI is above 1, confirming our conclusion that the project is under budget.
Keep an eye on project costs in Plaky
Schedule metrics
Finishing a project on time is one of the main requirements in project management.
Projects are usually split into phases, and each phase has one or more milestones, all with their own deadlines.
Tackling the project phases one milestone at a time makes it easier to track the project schedule continually. Some of the most used schedule metrics to keep a project in check are:
Schedule variance (SV)
Schedule variance measures the actual amount of performed work against planned work. It lets project managers check whether the team is completing the scheduled tasks on time at any given moment.
To calculate the schedule variance (SV), you’ll need to calculate the earned value, just like for cost variance. You’ll also need to figure out the planned value (PV):
SV = EV – PV
PV = % of expected completed work x total project budget
SV = (% of work completed – % of expected completed work) x total project budget
If the result is 0, it means all tasks have been completed on time, and there’s no need to worry. However, if it’s below zero, your team is behind schedule.
Let’s look at our example again. The plan was to finish one coat of varnish on day 2, which would have amounted to 50% of the work. Instead, 80% of the project was completed:
SV = (80% – 50%) x $,1000 = $300
The positive result shows us the project is well ahead of schedule.
Schedule Performance Index (SPI)
The schedule performance index measures the project’s compliance with the planned work.
The SPI is similar to schedule variance as it serves the same purpose and uses the same values, but it’s calculated slightly differently:
SPI = EV / PV
SPI = % of work completed / % of expected completed work
If the value of SPI is equal to 1, the project is right on schedule. Conversely, if the result is greater than 1, the tasks have been finished ahead of schedule, and vice versa.
In our example, the schedule variance showed that the project was ahead of schedule. Let’s see what the index says:
SPI = 80% / 50% = 1.6
The SPI is above 1, confirming that the work is ahead of schedule.
Improve your project scheduling with Plaky
Quality metrics
Quality metrics measure the product or process compliance with standard qualitative attributes. After all, cost efficiency and staying ahead of schedule don’t matter if the final result is below average.
Each industry has at least a dozen specific metrics they use to measure their performance, and every company within those industries has even more parameters to track.
For example, in the e-commerce industry, sales teams will track the inventory and advertising costs of sales. These metrics mean nothing to software development teams that keep an eye on burn-up charts and task estimates vs. actual task completion time.
Restaurants are another example that uses completely different metrics, such as sanitary standards and customer satisfaction. Finally, every marketing team will regularly measure customer loyalty with the net promoter score (NPS).
Either way, companies have to keep up with the industry trends and adjust their metrics to the current standards. Moreover, managers must track quality metrics regularly and intervene if the results are not satisfying. Remember — competitive markets are rarely forgiving when the products don’t meet stakeholder expectations.
Metrics vs KPIs
Metrics are calculated indicators that show if the project is meeting the planned values throughout its duration.
Key performance indicators are high-level business goals that teams try to achieve over a certain period of time.
Here’s a breakdown of the main differences between metrics and KPIs:
| Parameter | Metrics | KPIs |
|---|---|---|
| Business level | Operational | Strategic |
| Time frame | Short-term | Long-term |
| Scope | Measuring project performance | Measuring progress toward business goals |
| Reach | Projects or teams | Entire departments and organizations |
| Perspective | Present and past | Present and future |
To illustrate, if the marketing team of a software development company makes social media posts to boost product subscriptions, they’ll use the following metrics:
- Number of posts,
- Number of likes,
- Reach,
- Click-through rate,
- Advertising costs, and
- Number of new subscribers resulting from the campaign.
However, the KPI they’d use to measure the success of their marketing campaign could look something like this:
400 new product subscribers by the end of the year.
As you can see, metrics measure results at a certain point and are compared to what was planned.
In our example, the marketing manager might have planned to publish 3 posts per week, and the metrics could show whether the team followed the schedule. The actual costs could also be compared to the planned weekly budget.
In contrast, the KPI focuses on a business goal that can be achieved in different ways through different departments. The marketing team partially contributes to this goal with their social media campaign.
💡 Plaky Pro Tip
Learn more about how you can measure the performance of your team with 4 different groups of KPIs in our article:
Track your project’s KPIs with Plaky
How to choose the right metrics for your project
There isn’t a universal set of metrics that will be equally useful and meaningful to every business. For some organizations, quality is the most important indicator, with deadlines playing second fiddle. For other companies, time is crucial, and deadlines are immutable.
The best way to determine which metrics to choose is to establish the company or the team’s priorities. Once you know what kinds of results you want to achieve, it will be clear which metrics you should use.
For example, fast-food restaurants put speed and food standards above all. So, they’ll regularly measure how fast the food is served and perform quality control.
To compare, in the construction industry, companies will focus on costs and security standards, while marketing agencies will focus on schedules and engagement metrics.
Essentially, each industry has its own priorities, so they’ll choose the types of success metrics that reflect them.
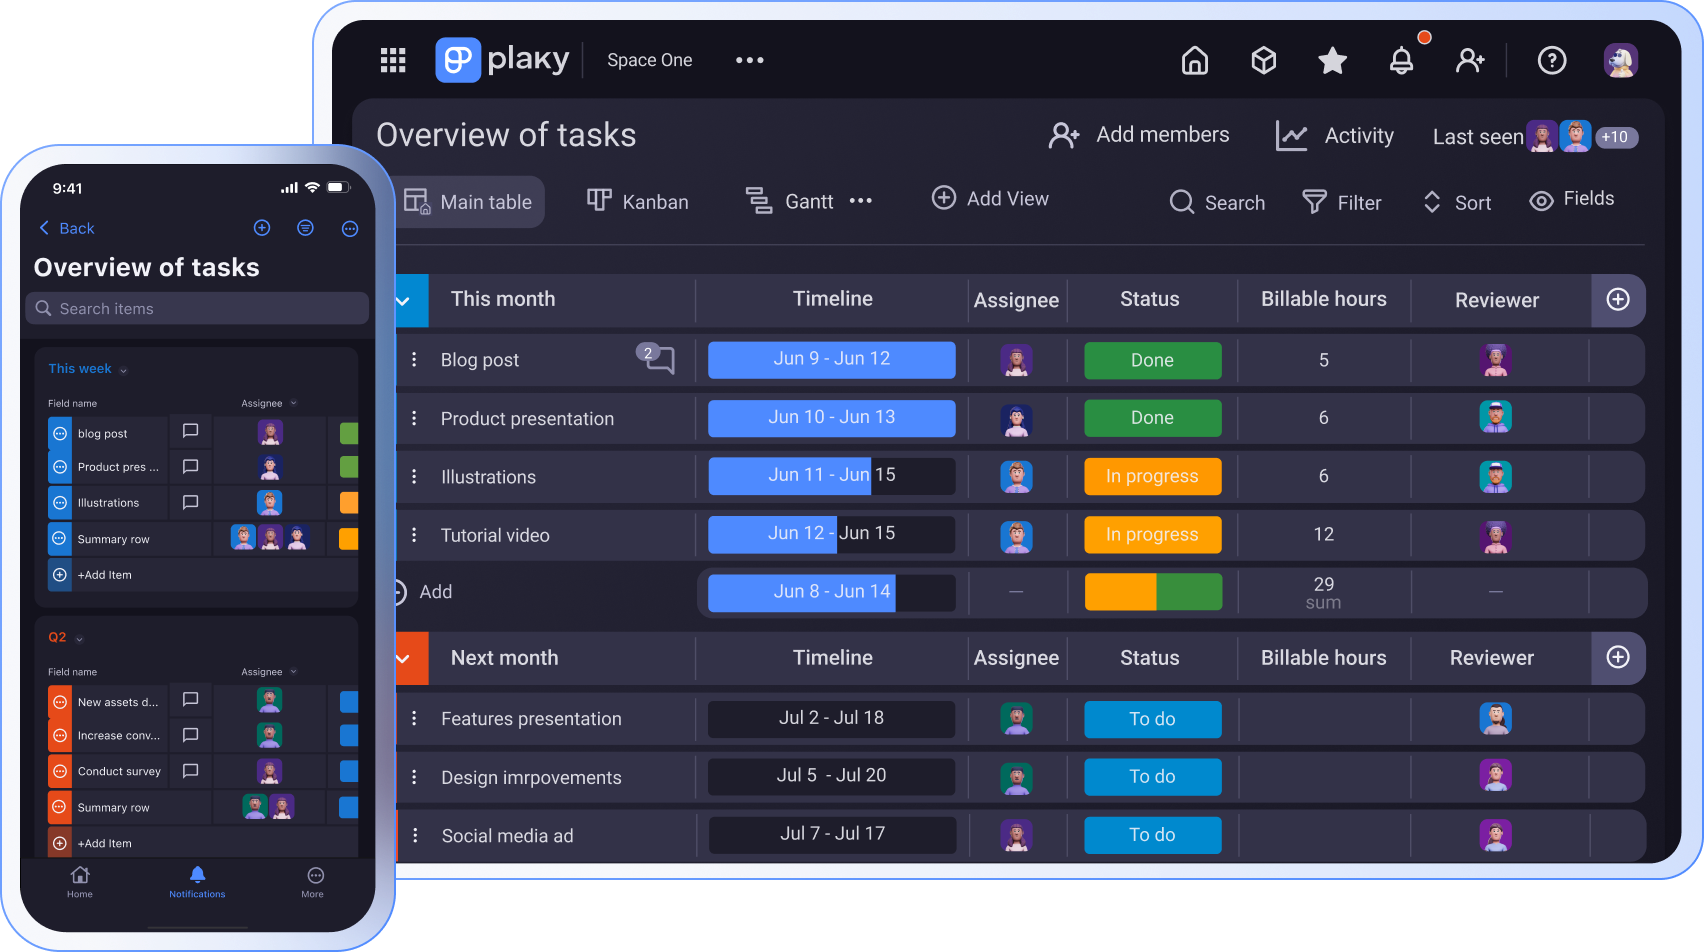
Not sure how to track project metrics? Try Plaky
Project managers know better than to run schedules and track results on whiteboards and notebooks. A well-organized system can help managers, stakeholders, and teams be on the same page throughout the project development.
You can organize entire projects and regularly keep an eye on their metrics with a project management tool like Plaky. Here’s how:
- Create a project board,
- Add custom fields,
- Invite your team and clients,
- Create items and attach the necessary files,
- Group items, and
- Aggregate data with summary rows.
Whether you go for a pre-made project management template or build it from scratch, you can customize your project board to include all the metrics you need to monitor.
Plaky’s intuitive design makes it easy to use and adapt to your needs, from organizing your work to communicating with your team.
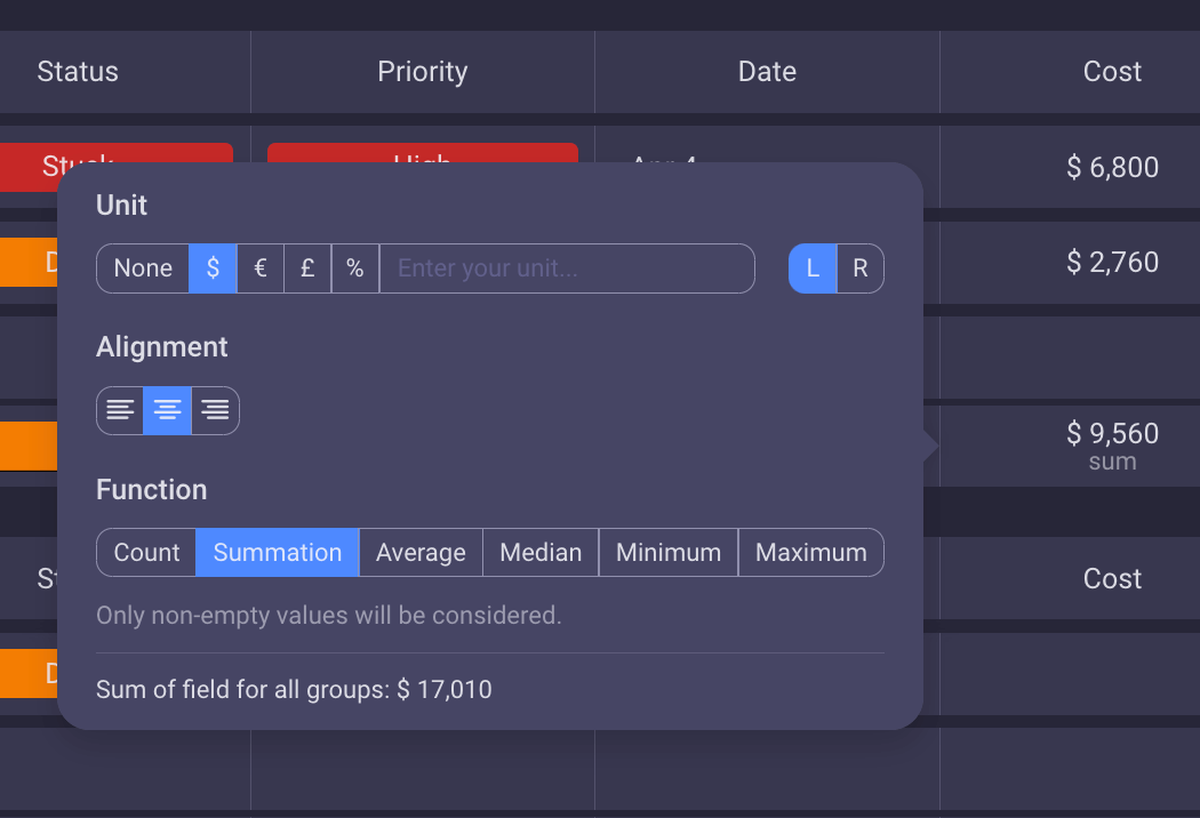
Also, the available functions eliminate even the need for a calculator as the values of each column can be automatically calculated in the summary row.
This way, you’ll save time by tracking metrics at a glance while managing all other aspects of your project in just one tool!
Interested in managing your projects and tracking metrics daily with ease? Create a free Plaky account now!
How we reviewed this post: Our writers & editors monitor the posts and update them when new information becomes available, to keep them fresh and relevant.