Are you wondering if adopting Agile is worth it, which Agile frameworks are the most suitable for you, or which of your teams would benefit from it the most?
The best way to get answers is to look at the success statistics and get a clear picture.
Read our article on Agile statistics to see the latest numbers and make data-driven decisions.
Key Agile statistics at a glance
Get an an idea of what’s to come and take a look at the most interesting Agile statistics:
- 41% of organizations increased their investment in Agile in the last 1–2 years. (18th State of Agile Report)
- 74% of companies had difficulties in coordination when setting up Agile. (Agile Survey 2024)
- Only 27% of people feel their organization’s Agile culture is enabling them to deliver real value and achieve goals. (18th State of Agile Report)
- 27% of teams using Kanban have more than 100 members. (Plaky data)
- Agile is used by the IT and software development teams in around 70% of organizations. (17th State of Agile Report)
- Small companies are more likely to have Agile incorporated in customer support and services teams than medium or large organizations. (17th State of Agile Report)
How we sourced these statistics
A part of these statistics, namely the ones regarding Agile frameworks, are original findings we sourced ourselves.
We have also extracted most interesting statistics from:
- 18th State of Agile Report by Digital.ai (2025)
- 17th State of Agile Report by Digital.ai (2023)
- Professional Scrum Certified Count by Scrum.org (2026)
- Agile Survey 2024 by PwC Luxembourg
- 2022 State of Kanban Report by Kanban University
- PMI’s Agile Certified Practitioner (PMI-ACP) statistics
Agile adoption statistics
Let’s start by looking at the Agile adoption statistics.
41% of organizations recently increased their investment in Agile
According to the Digital.ai’s 18th State of Agile Report, when people were asked how their organization’s investment in scaling Agile has changed over the past 12–24 months, the responses were as follows:
- 17% said it increased significantly.
- 24% claimed it increased somewhat.
- 27% said it stayed about the same.
- 24% felt it decreased.
- 8% were not sure/not applicable.
41% of companies adopt Agile to accelerate time to market
The 17th State of Agile Report shows customer and business value and accelerating time to market are the main reasons companies opt for Agile. Other reasons such as digital transformation and delivery predictability are close behind, though.
Here are the top reasons organizations gave for adopting Agile are:
| Reasons organizations choose Agile | Percentage |
|---|---|
| Prioritize, deliver, and measure incremental customer and business value | 41% |
| Accelerate time to market | 41% |
| Digital transformation | 34% |
| Delivery predictability | 30% |
| Managing distributed teams better | 18% |
| New feature availability | 14% |
| Product predictability | 14% |
| Lowering risk | 13% |
| Increasing revenue | 13% |
| Managing cost | 12% |
| New services availability | 7% |
| Something else | 6% |
| None of these, we don’t prioritize | 6% |
| Not at all sure | 4% |
Source: 17th State of Agile Report
Current state of Agile statistics
Here’s a quick rundown on the current state of Agile in organizations.
A quarter of respondents report inconsistent Agile usage in their organization
According to the 18th State of Agile report, when asked how they would describe the current state of Agile across their organization, this is what survey respondents expressed:
- 25% said Agile is practiced across some departments, but its usage is inconsistent.
- 22% claimed Agile is scaled across IT, but business involvement remains limited.
- 20% felt Agile practices are primarily limited to team-level execution.
- 13% said Agile is deeply embedded across business, technology, and supporting functions, with work aligned to strategic outcomes.
- 7% stated that they are transitioning from traditional delivery models (e.g., Waterfall) to Agile or hybrid approaches.
- 7% claimed they are reevaluating how they use Agile in light of new complexity (e.g., AI, compliance, ways of working, etc.).
- 6% say they are not sure or give other answers.
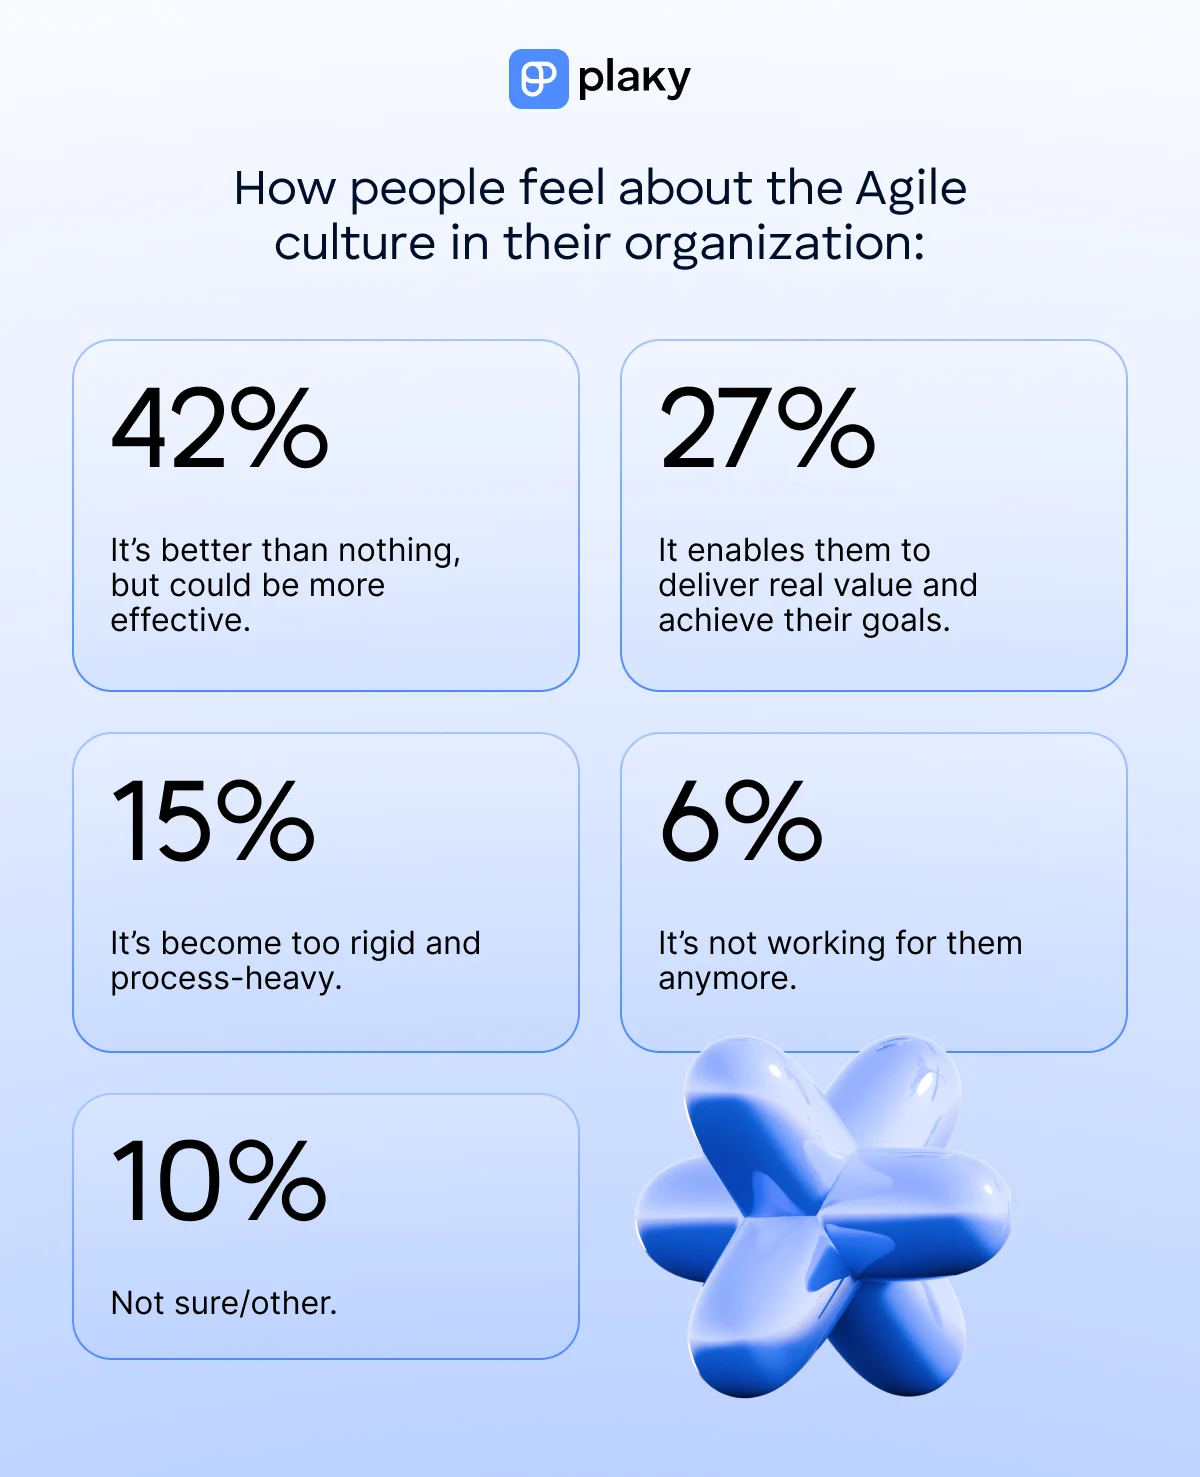
Only 27% of people feel their organization’s Agile culture is enabling them to achieve goals
In the same report, when asked what best describes their feelings about the Agile culture in their organization, people responded as follows:
- 42% said it’s better than nothing, but could be more effective.
- 27% felt it’s enabling them to deliver real value and achieve their goals.
- 15% claimed it’s become too rigid and process-heavy.
- 6% said it’s not working for them anymore.
- 10% were not sure/other.
Agile success and failure rates
Here are the most relevant statistics on success and failure rates in Agile projects.
Almost ¾ of companies had difficulties in coordination when setting up Agile
According to Agile Survey 2024, when asked what the main negative feedback received related to the set up Agile is, companies listed 5 different issues.
| Issues when setting up Agile | Percentage |
|---|---|
| Difficulty in coordination | 74% |
| Lack of organizational change management | 70% |
| Managers experience difficulties in adoption to new leadership paradigm | 57% |
| Loss of efficiency in delivery | 39% |
| Frictions between employees | 17% |
Source: Agile Survey 2024
The development of new collaboration modes is the most common positive outcome of setting up Agile
In the same survey, respondents singled out 7 positive outcomes when setting up Agile:
| Positive outcomes of setting up Agile | Percentage |
|---|---|
| Development of new collaboration modes | 74% |
| Improved overall quality | 48% |
| Increased productivity | 39% |
| Time savings, improved service delivery/product | 39% |
| Reconciliation with clients | 30% |
| Improved quality of life at work, commitment of employees | 26% |
| Increased capacity for innovation | 26% |
Source: Agile Survey 2024
Agile frameworks statistics
Various methodologies and frameworks fall under the Agile umbrella, most famous being Kanban and Scrum.
Here are the most important statistics on these 2.
Kanban is mostly used by teams between 50 and 100 members
Plaky’s statistics shows that 23.07% of PM users have at least one Kanban board.
In terms of the size of teams using Kanban boards, Plaky’s data show that:
- 27% are teams with more than 100 members (with 2% having more than 200).
- 73% are teams between 50 and 100 members.
Kanban is used by the entire organization in only 13% of companies
The State of Kanban Report shows that Kanban is usually used by 2–5 teams, with only 13% of organizations using it in all teams.
Here’s a detailed breakdown of the numbers:
| Number of teams using Kanban | Percentage |
|---|---|
| None | 3% |
| 1 | 7% |
| Between 2 and 5 | 32% |
| Between 6 and 10 | 14% |
| More than 10 | 31% |
| Entire company | 13% |
Source: State of Kanban Report
Half of Kanban users find Kanban much more effective than other methods/frameworks
The same report shows that people generally consider Kanban to be more effective than other methods or frameworks — 50% of users consider it much more effective while 37% think it’s more effective.
Only 12% think it’s somewhat the same as others.
Most respondents were using a different methodology before Kanban. Here’s the breakdown of the background of teams before they switched to Kanban:
| Former methods/frameworks | Percentage |
|---|---|
| Scrum | 57% |
| No clear way of managing their work | 37% |
| Waterfall | 35% |
| SAFe | 7% |
| XP | 4% |
| CMMi | 2% |
| Other | 4% |
Source: State of Kanban report
23% of users reported increased visibility of flow after adopting Kanban
State of Kanban Report lists the main benefits of adopting Kanban as well:
| Benefits of adopting Kanban | Percentage |
|---|---|
| Increased visibility of flow | 23% |
| Improved delivery speed/throughput | 15% |
| Improved predictability | 13% |
| Alignment between business objectives, key results, and delivery work | 13% |
| Improved ability to manage scale and dependencies | 10% |
| Increased customer satisfaction | 9% |
| Improved quality | 8% |
| Improved risk management | 7% |
| Decreased project management cost | 3% |
Source: State of Kanban Report
86% of Kanban users plan to expand Kanban implementation in the next year
The same report shows that, when asked whether they plan to expand Kanban implementation in the next 12 months, 27% of respondents stated they plan to expand Kanban within the same functional areas, while 60% plan to expand it within the same and other functional areas.
Only 14% don’t plan to expand Kanban implementation at all.
More than half of Agile teams use Scrum methodology
According to the 17th Annual State of Agile Report, Scrum is the most popular Agile methodology — 63% of Agile teams use Scrum methodology.
However, Plaky’s statistics on teams using PM software, shows that only 2.66% of workspaces use Scrum boards.
The majority of teams using Scrum have under 50 members
When it comes to the size of teams, Plaky’s research into Scrum boards shows that:
- 45% of teams have less than 20 members.
- 41% of teams have between 20 and 50 members.
- 11% of teams have 100 or more members.
- 3% of teams have between 50 and 100 members.
Agile certification statistics
Let’s take a look at what certifications in Agile exist and how they can influence careers.
Professional Scrum Master is the most popular Agile certification with 828,999 users
According to Scrum.org, there are over 1,212,100 Professional Scrum certifications held globally.
Here’s the breakdown of all certifications:
| Certifications | Number |
|---|---|
| Professional Scrum Master (PSM) | 828,999 |
| Professional Scrum Product Owner (PSPO) | 300,830 |
| Professional Scrum Developer | 29,943 |
| Professional Agile Leadership | 21,263 |
| Professional Scrum with Kanban | 9,399 |
| Scaled Professional Scrum | 7,721 |
| Professional Agile Leadership — Evidence Based Management | 5,549 |
| Professional Scrum with User Experience | 4,071 |
| Professional Scrum Facilitation Skills | 3,341 |
| Professional Scrum Product Owner — AI Essentials | 2,661 |
| Professional Scrum Product Backlog Management Skills | 2,085 |
| Professional Scrum Master — AI Essentials | 1,382 |
| Professional Product Discovery and Validation | 908 |
Source: Scrum.org
More than ¾ of PMI Agile Certified Practitioners qualify for new opportunities
According to PMI’s statistics, 86% of PMI Agile Certified Practitioners (PMI-ACPs) qualified for new opportunities upon getting the certification.
Another statistics that highlights the importance of PMI certification is that a whopping 84% of PMI-ACPs gained recognition for career advancement.
Agile statistics across teams
Here’s a breakdown of how Agile is adopted across teams within companies.
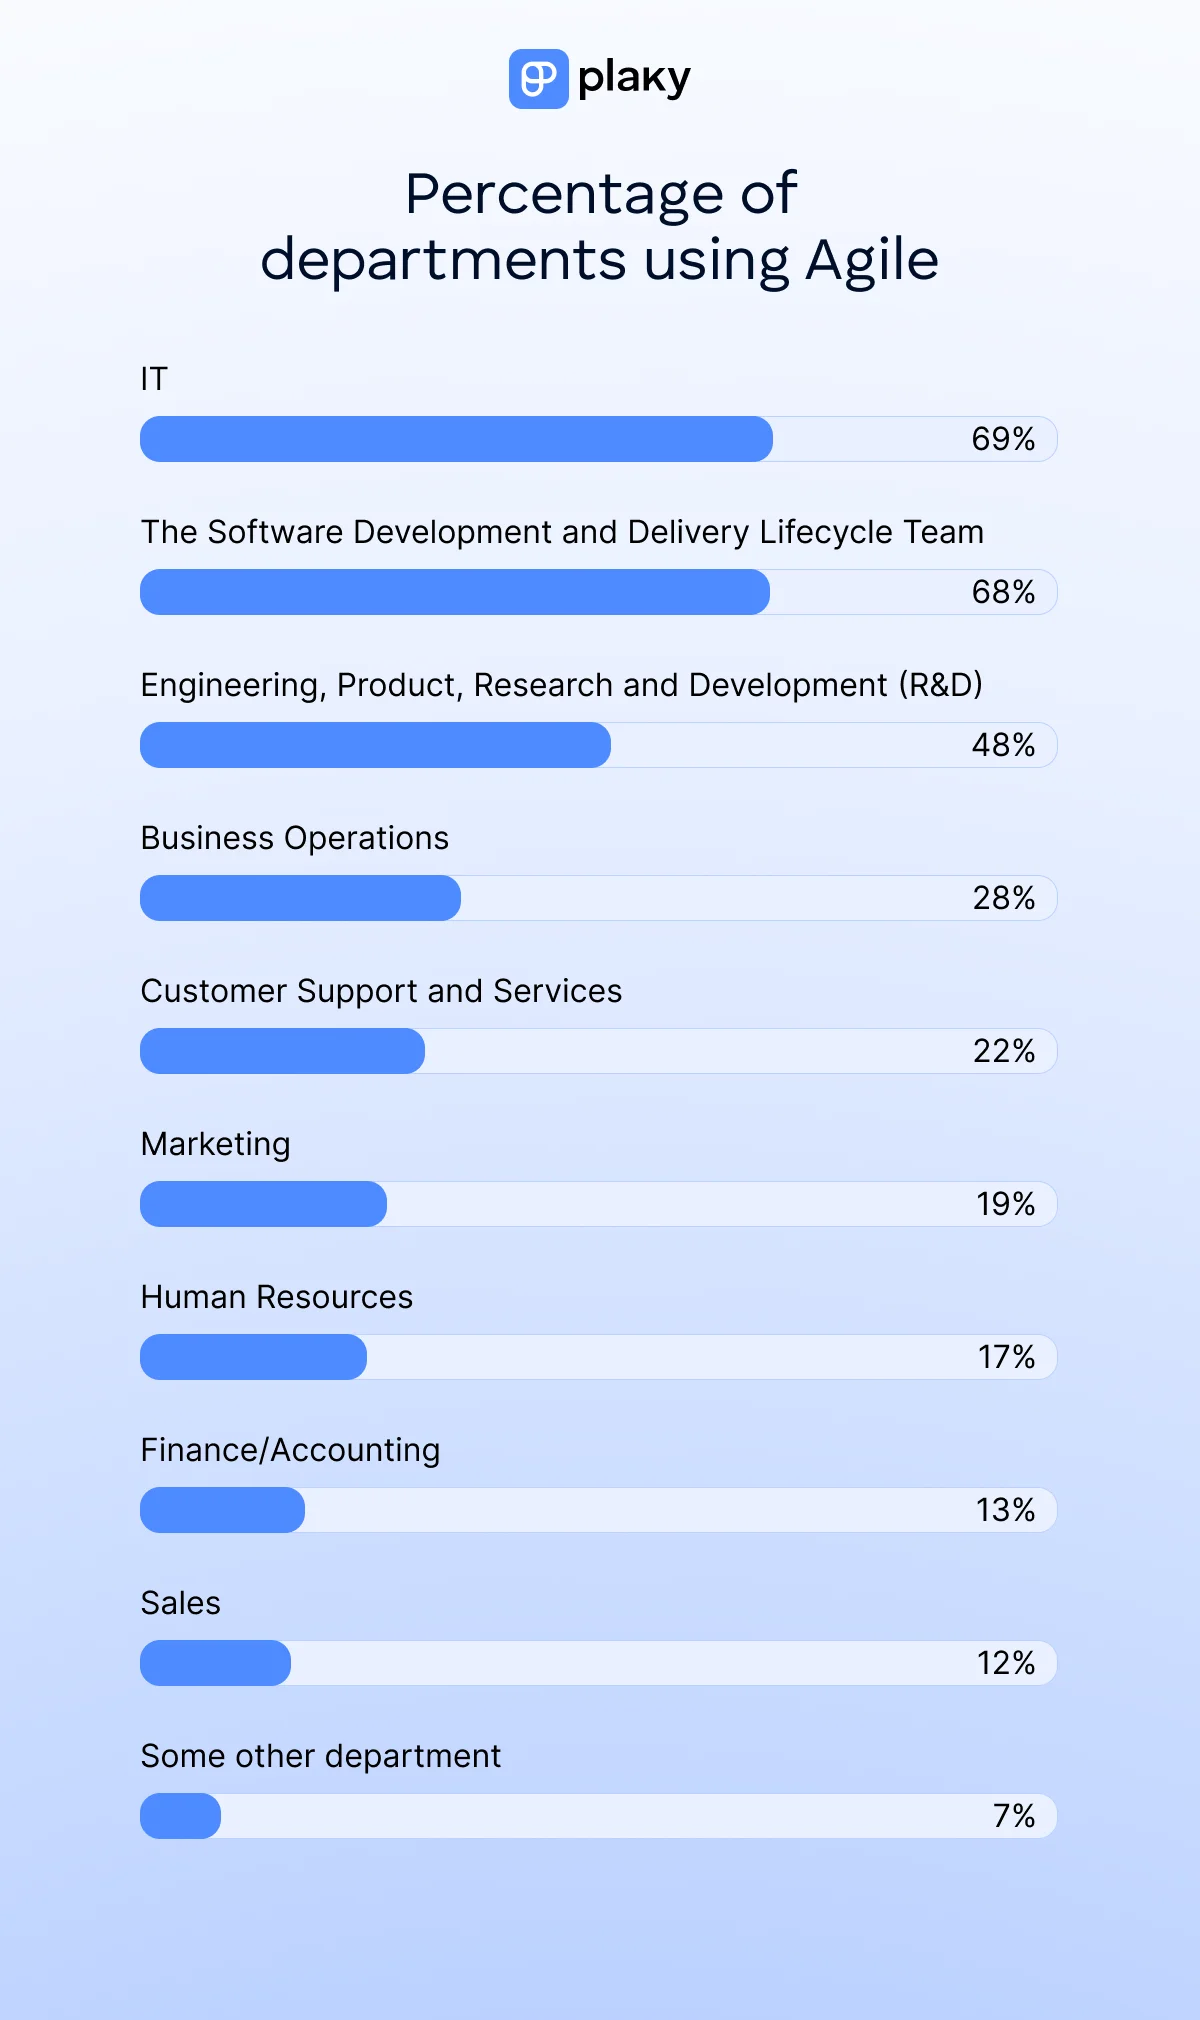
Agile is used by the IT department in around 70% of organizations
The 17th State of Agile Report shows that Agile is most commonly used in IT and software development and delivery teams — almost 70% of organizations report these departments adopting Agile. Still, many other teams implement Agile as well.
The departments that most commonly use Agile are:
| Departments | Percentage |
|---|---|
| IT | 69% |
| The Software Development and Delivery Lifecycle Team | 68% |
| Engineering, Product, Research and Development (R&D) | 48% |
| Business Operations | 28% |
| Customer Support and Services | 22% |
| Marketing | 19% |
| Human Resources | 17% |
| Finance/Accounting | 13% |
| Sales | 12% |
| Some other department | 7% |
Source: 17th State of Agile Report
Sales and customer teams in small teams are more likely to use Agile than mid or large companies
Not all organizations report the same numbers. The same report finds there’s a noticeable difference between small, mid, and large companies.
Small companies are more likely to have Agile incorporated in customer support and services — 33% vs. 16% in medium and 20% in large companies.
Sales teams also use Agile more in small companies — 23% vs. 5% in medium and 10% in large companies.
However, IT teams in medium and large companies are more likely to adopt Agile than those in small businesses — 72% and 73% compared to 62%.
Agile statistics FAQ
Here are some of the most common questions about Agile statistics.
Do statistics show that Agile is still relevant in 2026?
Yes, Agile is still a popular approach in 2026 — 41% of organizations increased their investment in Agile in the last couple of years.
Agile is especially relevant in IT and software development, since nearly 70% of organizations report their departments adopted it. (17th State of Agile Report)
What stops Agile from working?
According to the 17th State of Agile Report, the biggest issues that stop Agile from working are connected to businesses being slow to adopt Agile:
- 47% of survey responders named generalized resistance to organizational change or culture clash as the main reason.
- 41% of them claimed there is not enough leadership participation.
- 38% of them blamed inadequate management support or sponsorship.
Adopt Agile the right way with Plaky by CAKE.com
To ensure you are successful in implementing Agile into your organization, try Plaky.
Plaky offers a clear and user-friendly structure for your projects, consisting of project Boards filled with Items and Subitems representing tasks. You can add any type of information to tasks thanks to Plaky’s custom Fields (status, dates, links, priority, description, etc.)
Plaky boasts 4 functional board views — Table, Kanban, Gantt, and Chart view.
You can use Plaky’s Kanban view to:
- Visualize progress — drag and drop tasks across stages to easy visual progress tracking.
- Spot bottlenecks — easily notice when one stage starts overflowing with tasks and handle it immediately.
- Automate tasks — use Plaky’s Board automations to streamline your Agile projects.
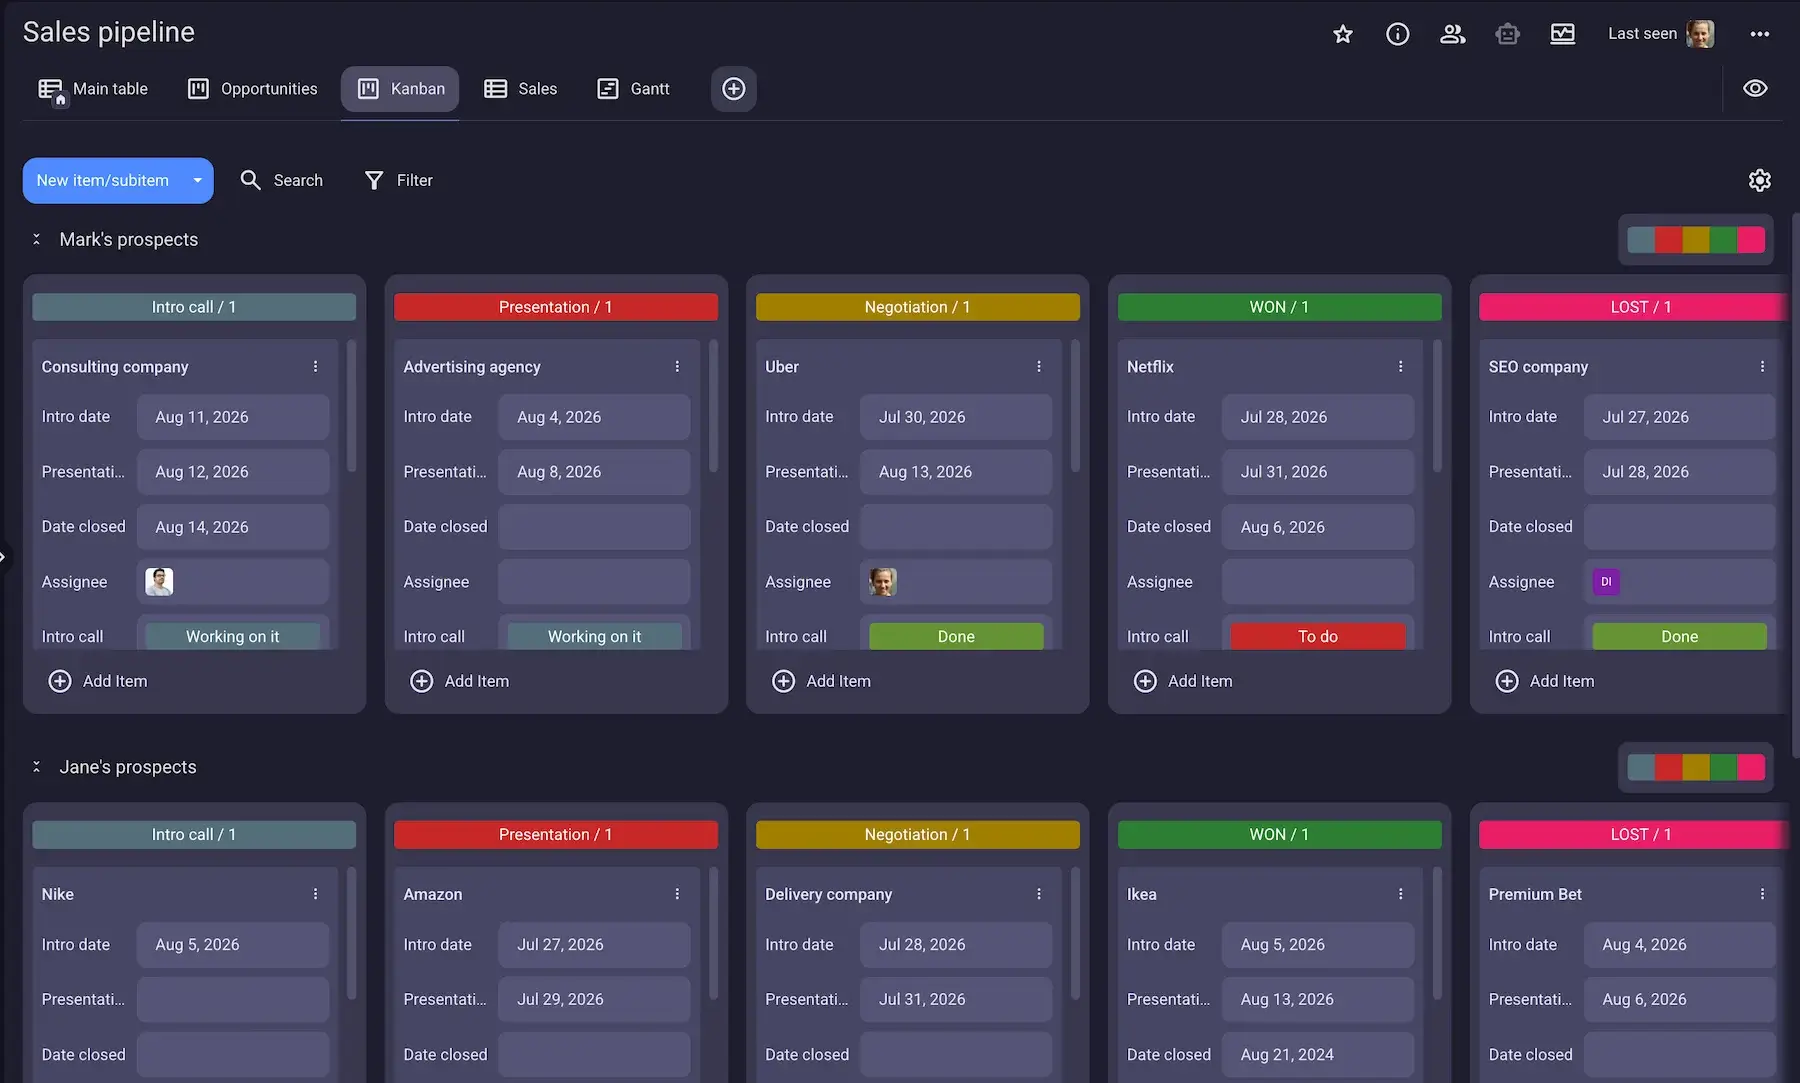
And, if you’re a fan of Scrum, you can use Plaky’s Scrum template to get a ready-to-use project board where you can manage your sprint plans. Bonus — the Scrum board can be in Kanban view, too!
Be on the successful side of Agile statistics with Plaky. Try it for free today!
How we reviewed this post: Our writers & editors monitor the posts and update them when new information becomes available, to keep them fresh and relevant.