 Updated: March 28, 2025
 The critical path method (CPM) is a project management tool used to calculate the time necessary to complete an upcoming project.
Learn how to add this great tool to your arsenal and create a CPM in 6 simple steps!

- The critical path method (CPM) is a tool used in the planning phase to determine the project’s approximate length.
- Finding the project’s critical path includes identifying activities, their duration, and their interconnections before drawing a diagram and discovering the critical and non-critical paths.
- One of the best and most efficient ways to map out a project’s schedule and total duration is to calculate the critical path.
- The CPM and Gantt charts are both visual tools in project management. The former uses diagrams to represent project activities while the latter uses a horizontal timeline.
What is the critical path method (CPM)?
The critical path method is a scheduling algorithm that calculates how long a project will take to complete by identifying its critical path.
The critical path is the longest sequence of dependent project activities. CPM also highlights how much extra time you have to perform activities that aren’t on the critical path, thereby showing you where you can be flexible without missing the deadline.
This allows you to prioritize tasks and manage resources in a way that supports progress toward project completion.
How to find a project’s critical path
Finding a project’s critical path requires a thorough understanding of the project’s activities and the necessary effort to complete them.
Here are the 6 steps to find the project’s critical path:
- List project activities.
- Identify the dependencies.
- Create a network diagram.
- Estimate the duration of tasks.
- Calculate the critical path.
- Calculate the float.
Let’s go through the critical path method in detail.
Step #1 List project activities
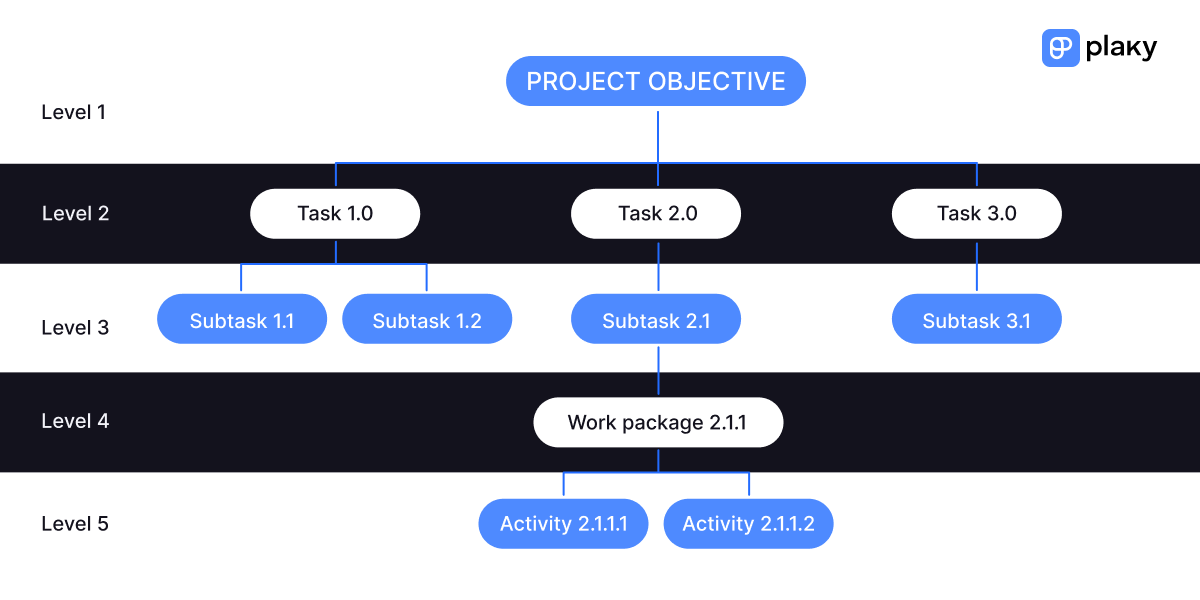
You can use a work breakdown structure to list all the project activities hierarchically. This means you’ll divide the project into logical units that you will then decompose further into specific tasks.
The WBS usually takes the form of a tree diagram, but you can also create grouped task lists.
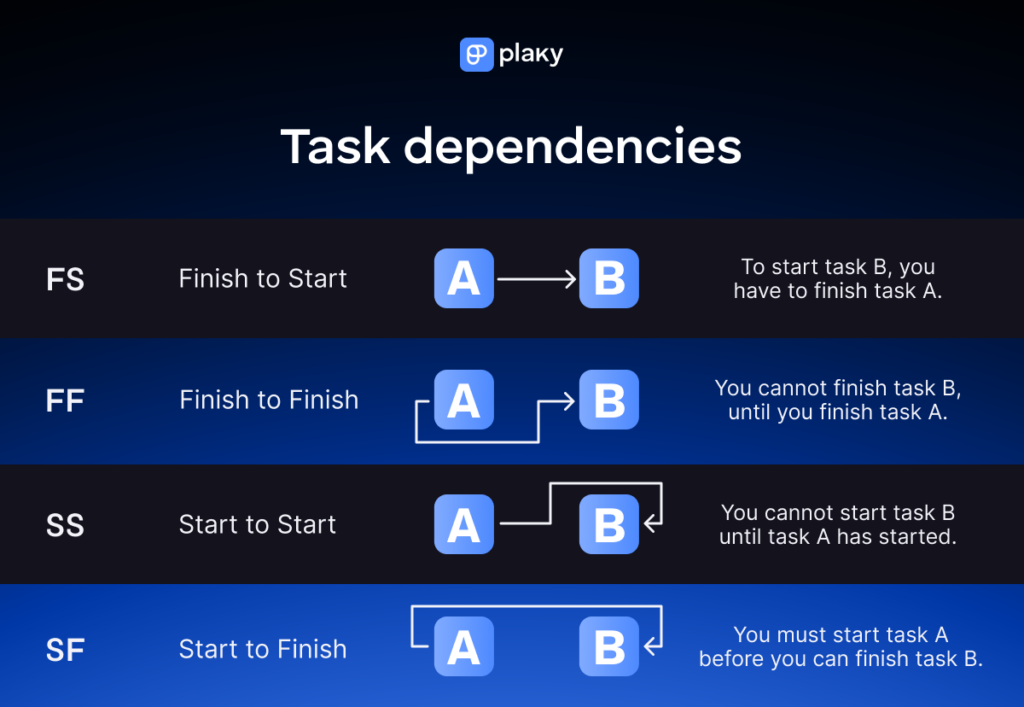
Step #2 Identify dependencies
Once you’ve listed all the activities necessary to achieve project goals, you can start connecting them. You’ll know if there are task dependencies if, for example, a task can’t start before another is finished.
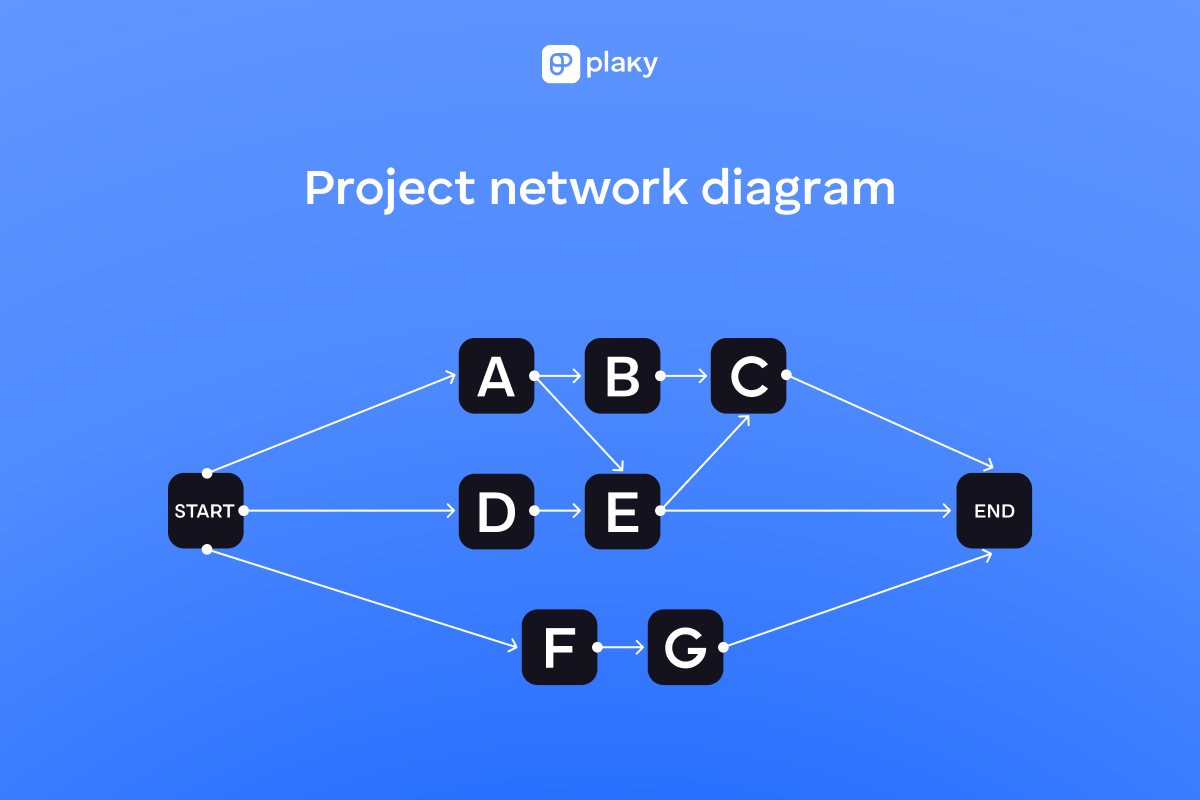
Step #3 Create a network diagram
A project network diagram is made of nodes and arrows that represent activities, their relationships, and their durations.
For now, you can draw the diagram and add the time estimates in the next step.
Step #4 Estimate the task duration
Now, it’s time to write down the estimated duration of each task.
The most common way to make estimates is to rely on previous experiences. If you don’t know how long an activity will take, you can resort to expert judgment, group decision-making, or yet another estimation technique.
In this step, you can also use the forward and backward pass technique:
- The forward pass is the act of calculating the early start (ES) and early finish (EF) times of all activities and highlighting the critical path. Early start time is the earliest possible point at which you can start working on a task while early finish time refers to the earliest moment at which it is possible to finish a task.
- The backward pass is the act of calculating the late start (LS) and late finish (LF) times of all project activities. Late start time denotes the latest point at which you can start work on an activity without it prolonging the overall project timeline. On the other hand, late finish time is the latest point at which you can complete an activity without it extending the overall timeline.
First, you’ll need to calculate the ES and EF to determine the forward pass.
The ES for the first task(s) in a project is set to 0.
To calculate the ES for all other tasks, just copy the EF (early finish time) of the preceding dependent task. If a task is dependent on 2 or more previous activities, refer to the activity with the longer ES.
To calculate the early finish time for a task, you take its ES and add the task duration (Dur).
EF = ES + Dur
Since the first activity in a project generally has an ES of 0, the EF will be identical to the duration of the first activity.
All dependent tasks that follow immediately after it will take the first task’s EF as their ES. Add their duration to it to calculate their EF.
Once you’ve finished calculating the forward pass to identify the critical path, it’s time to do a backward pass using late start and late finish values.
To calculate the LS of an activity, use the following formula:
LS = LF – Dur
The LF of a node is equal to the LS of the subsequent one.
Tasks that are on the critical path have identical LF and EF values.
To calculate the LF of tasks that aren’t on the critical path, you have to start with the project completion node and work your way backward.
Step #5 Calculate the critical path
The critical path is the sequence of dependent activities with the longest overall duration.
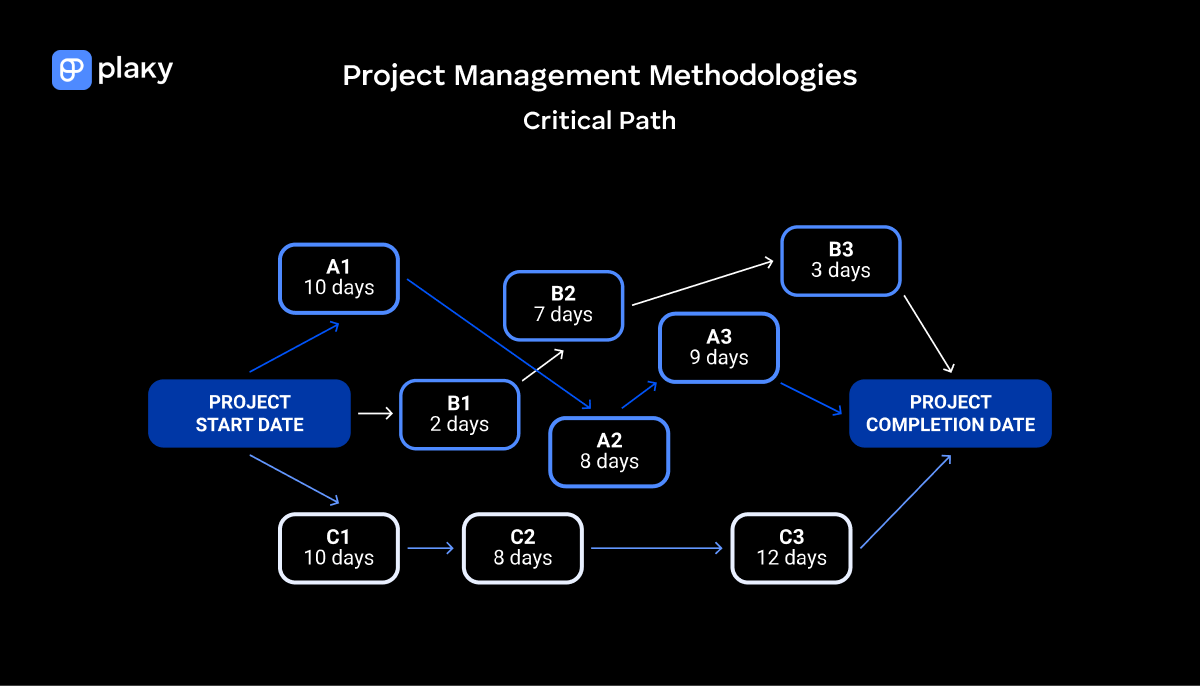
In the diagram above, the C1-C2-C3 string of activities constitutes the critical path, as they take 30 days to complete.
The alternative routes — consisting of activities A1-A2-A3 OR B1-B2-B3 — take only 27 days and 12 days to complete respectively.
In other words, no matter how quickly you go through these secondary routes, the project won’t be completed until the activities on the critical path are done. Even if activities B1, B2, and B3 took twice as long to complete, they wouldn’t impact the deadline at all.
Step #6 Calculate the float
Total float is the amount of wiggle room you have before you must start working on tasks that are not on the critical path.
To calculate total float, use either of the following formulas:
TF = LF – EF
TF = LS – ES
Total float vs. free float
Total float is the total amount of extra time you have to complete tasks that are not on the critical path.
On the other hand, free float shows the extra time at disposal to complete a non-critical path task without delaying any subsequent tasks.
As you can see, the difference between them is entirely contextual.
When we have several non-critical path tasks chained together, the backward pass calculations show that they all have the same float.
But if you extend one of those tasks by any amount, you’ll reduce the remaining float of subsequent tasks in that chain.
However, you’ll sometimes run into non-critical path tasks that aren’t part of an expanded chain of such tasks. We say that those tasks have free float because using up their float won’t reduce the float of any subsequent activity.
For example, if we had just one task labeled A instead of the task chain A1-A2-A3, then A would have free float.
💡 Plaky Pro Tip
CPM is one of the most used techniques in project management. Check out some other popular project management tools here:
Critical path method example + template
Let’s go through the critical path method step by step, using a YouTube video production project as an example.
To make our YouTube video, we’ll need a simple WBS like this:
| Task designation | Task description | Task duration |
|---|---|---|
| A. | Research the topic | 5 days |
| B. | Create a concept | 3 days |
| C. | Write a script | 4 days |
| D. | Edit the script | 2 days |
| E. | Create a title | 1 day |
| F. | Record the voiceover audio | 1 day |
| G. | Record the footage | 10 days |
| H. | Edit the footage and audio | 5 days |
| I. | Create thumbnails | 1 day |
| J. | Promote the video on social media | 3 days |
| K. | Upload the video to YouTube | 1 day |
We figured out which tasks needed to be done to create a video from scratch and upload it to YouTube.
Then, we assigned a duration to each task and linked them based on their dependencies.
This is all the data we need to do all the calculations necessary for using the critical path method.
Each activity can be represented on an activity node with the following elements:
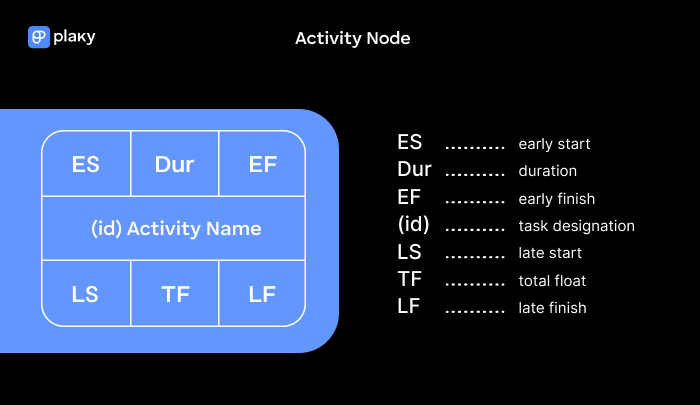
Since task (a) Research the topic has an ES of 0 and a duration of 5 days, its EF is 5.
EF = ES + Dur = 5 + 0 = 5
We can see that the ES of task (b) Create a concept is 5 — the earliest you can start doing this task is on day 5. Since task (b) has a duration of 3 days, its EF is 8.
EF = ES + Dur = 5 + 3 = 8
Now, once you’ve finished work on task (b), you can immediately start working on 2 independent tasks — (c) Write a script and (g) Record the footage. Both of these tasks will have the same ES of 8, but different EF times.
EF = ES + Dur = 8 + 4 = 12
EF = ES + Dur = 8 + 10 = 18
Once you’ve done this for all activities, you can see which sequence of activities takes the longest to complete.
Keep in mind that we are calculating the total time needed for project completion, not the number of activities.
Here’s what the CPM diagram looks like in this example:
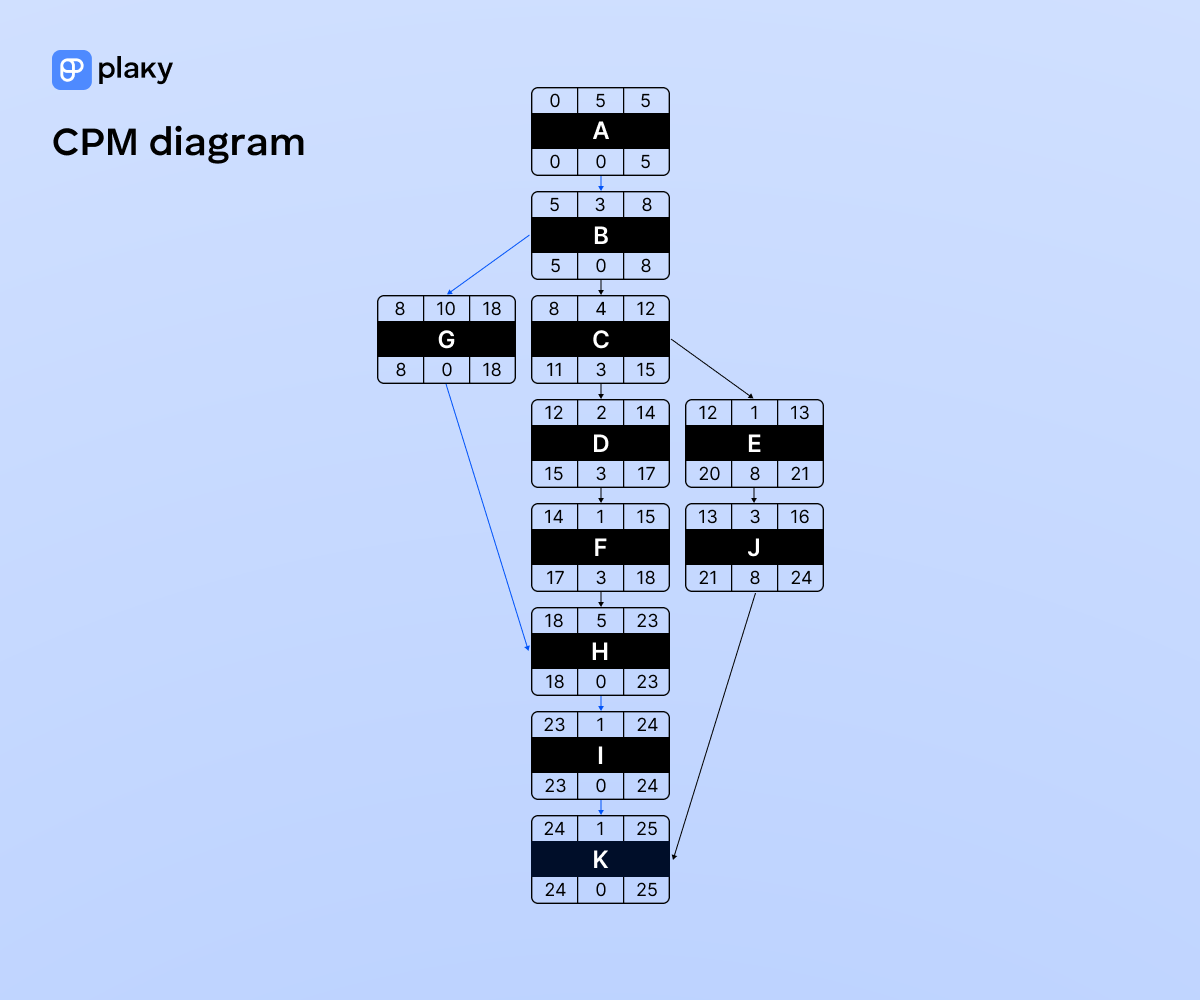
In this case, the sequence of nodes that will take the longest to complete is (a)-(g)-(h)-(i)-(k) — this is the critical path.
The calculations show us that the project would take at least 25 days to complete if no tasks on the critical path get delayed:
5 + 3 + 10 + 5 + 1 + 1 = 25
No matter what you do, you will not be able to complete the project in under 25 days since that’s how much time all the tasks on the critical path require.
Therefore, node (j) Promote the video on social media has an LF of 24, as this is the LS value of node (k) Upload the video to YouTube. To calculate its LS, we use the following equation:
LS = LF – Dur = 24 – 3 = 21
We can then use the LS of task (j) to calculate the LF of (e) Create a title, and so on until we’ve done this for all tasks.
Whichever formula you choose, you’ll get the same result. Let’s demonstrate this on task (j) Promote the video on social media:
TF = LF – EF = 24 – 16 = 8
TF = LS – ES = 21 – 13 = 8
What this shows us is that, even if promoting the video takes longer than expected, you won’t disturb the schedule because you have 8 days of space to complete that task.
To help you calculate the duration of your upcoming project, we’ve created a simple CPM template you can access below.
Critical path method advantages
The main advantages of the critical path method are that it:
- Calculates how long it will take to complete a project,
- Helps you create an efficient project schedule,
- Shows you which project tasks can be extended without pushing back the project deadline,
- Helps bring the project back on track — when a project encounters setbacks, the project manager can use float to formulate countermeasures,
- Is easy to use (you just need to know what tasks need to be done, how they relate to one another, and how long each task will take), and
- Is still one of the best ways to map out a project schedule and increase its efficiency.
The disadvantages of CPM
Now, for all its benefits, CPM does carry some drawbacks that are worth pointing out:
- CPM uses task duration as its primary input, but it doesn’t tell you how to estimate these durations. Meanwhile, any errors in these estimates can affect the calculations. This means that if your task duration assumptions are off, your calculations will be off as well.
- CPM assumes that time is the only constrained resource. If we refer back to the video production project example, the critical path diagram is useless when one person needs to do everything on their own as they can’t do 3 tasks at the same time.
💡 Plaky Pro Tip
If you need a scheduling algorithm that can account for multiple resource constraints, we suggest reading our guide on Critical Chain Project Management:
Critical path method vs. PERT
The main difference between CPM and PERT is that the former calculates the time length of the entire project based on estimates of predictable activities while the latter focuses on giving 3 duration assessments of uncertain activities.
CPM and PERT (Program Evaluation Review Technique) are both scheduling tools, and they were also developed around the same time.
Much like CPM, PERT requires you to break the project down into bite-sized tasks and map out the necessary sequence of tasks based on their dependencies.
PERT, however, provides some guidelines on how to estimate the duration of each task.
This is done by assigning each task 3 potential durations:
- The most optimistic (O) time needed to complete each task,
- The most probable (M) time needed to complete each task, and
- The most pessimistic (P) time needed to complete each task.
Once you have this data, you can calculate the PERT estimate (E) using the following equation:
E = (O + 4M + P) / 6
In addition to this, charting out the timeline using PERT means starting from the deadline and working your way backward.
💡 Plaky Pro Tip
Looking for more ways to manage your projects? Check out our guides:
Critical path method vs. Gantt chart
The main difference between the CPM and Gantt charts is in their visual representation. The CPM is usually drawn as a network diagram while Gantt charts are horizontal bar charts used to visualize a project’s schedule.
Perhaps the most widely used scheduling tool today, Gantt charts were developed around the time of the First World War by Henry Gantt, who used them to measure the productivity of his employees.
There are pros and cons to using either of these methods. If you need to visualize your project on a timeline, and it’s important to show the necessary resources, you should use a Gantt chart.
However, if you need to visualize activities on a critical and a non-critical path, the CPM is a better choice.
Critical path method terminology
Now that we’ve determined how to calculate the critical path and how it compares to other methods, we can sum up all the terminology briefly.
- Critical path — the sequence of dependent activities with the longest overall duration.
- Activity nodes — rectangles or boxes used in CPM diagrams designed to hold all the crucial information needed for charting a project’s critical path.
- Early start time (ES) — the earliest possible point at which you can start working on a task.
- Early finish time (EF) — the latest possible point at which you can finish working on a task.
- Duration (Dur) — how long you expect a task will take to complete.
- Late finish time (LF) — the latest point at which you can complete an activity without it prolonging the overall project timeline.
- Late start time (LS) — the latest point at which you can start work on an activity without having it prolong the overall project timeline.
- Total float (TF) — the amount of time you have before you must start working on tasks that are not on the critical path.
- Free float (FF) — additional available time to complete a non-critical path task without delaying any subsequent tasks.
📖 Now that you understand how the Critical Path Method works, dive further into the subject of project management — explore our Project Management Glossary of Terms.
Use a project management software — try Plaky by CAKE.com for free
The critical path method is a superb tool for project planning, but you need to keep tracking progress to make sure your project stays on schedule.
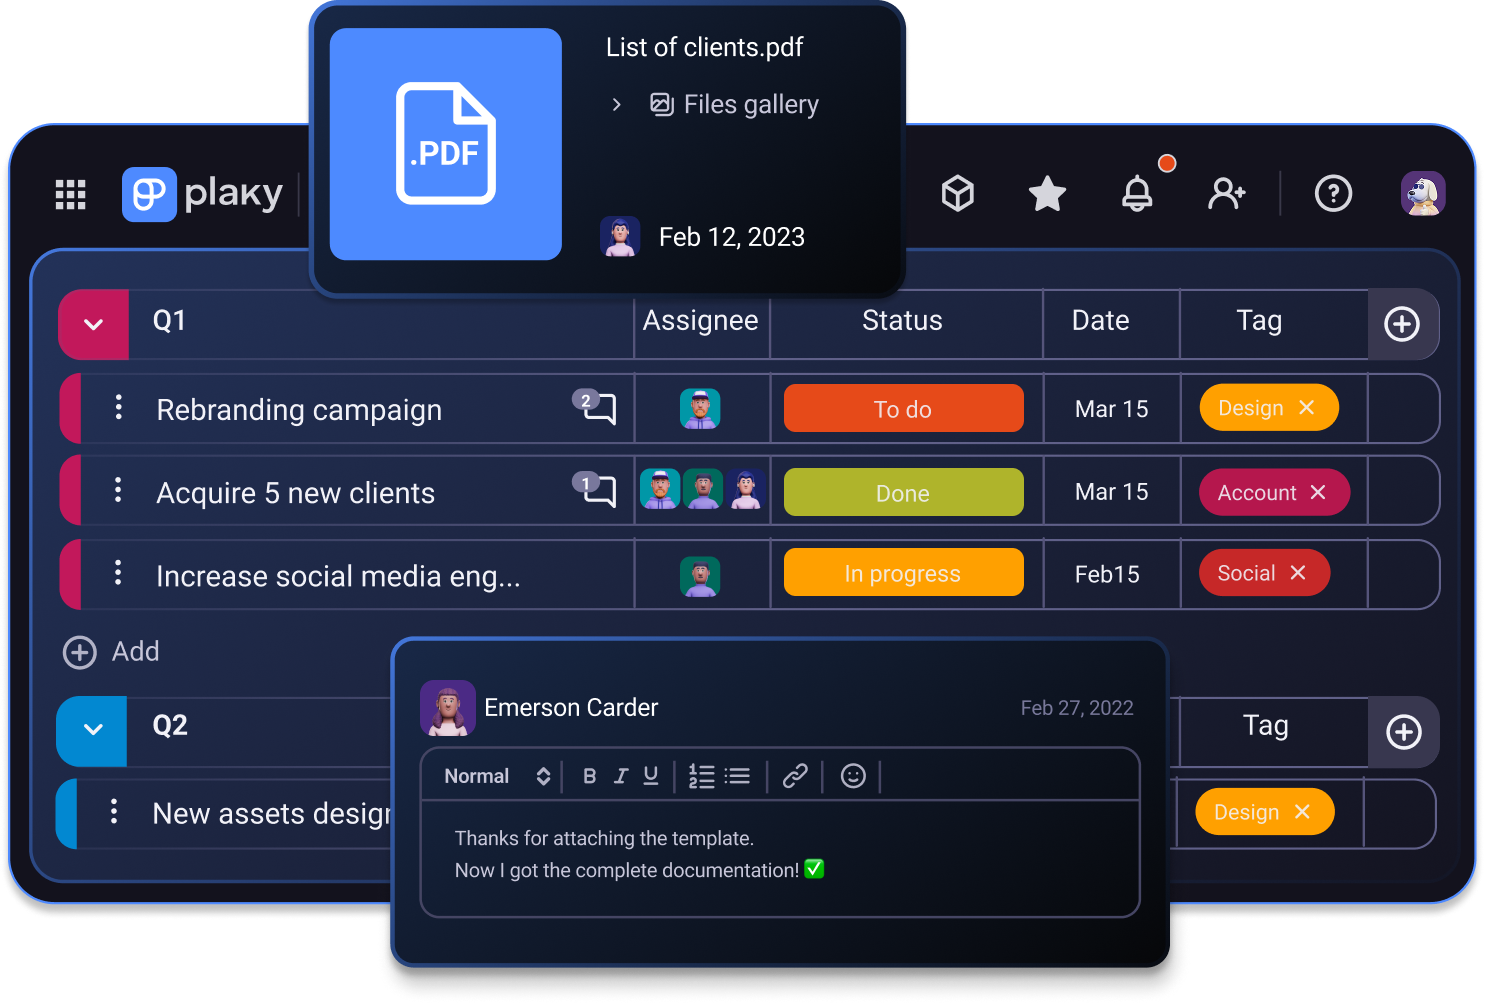
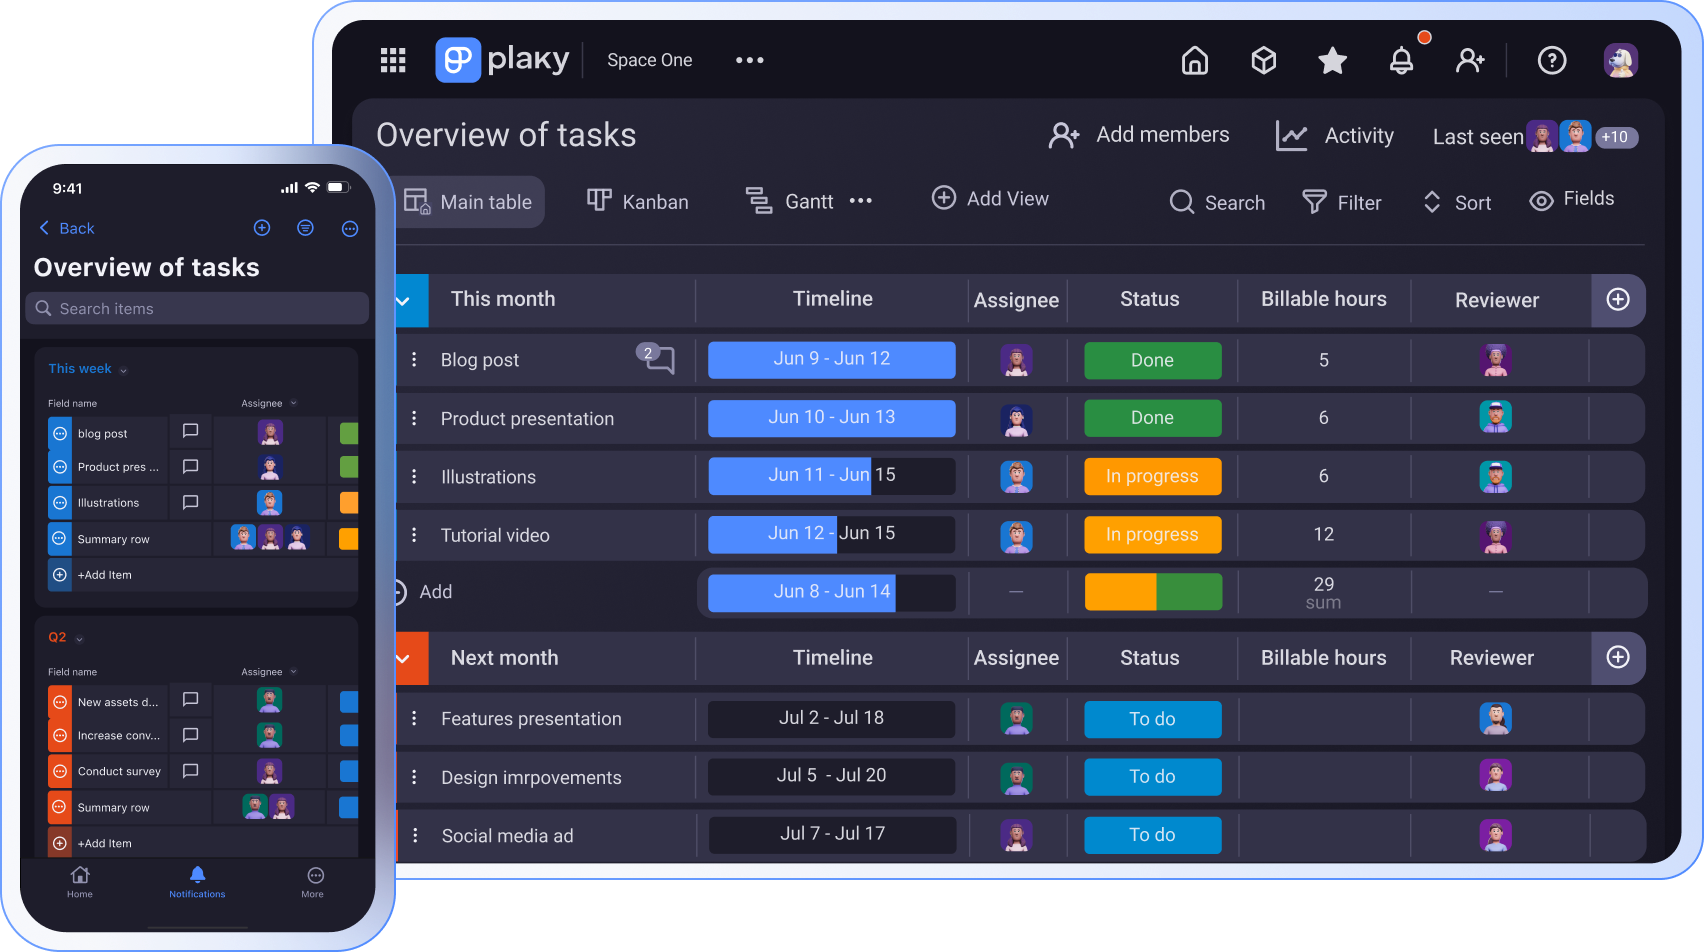
Luckily, you can use a task management platform like Plaky by CAKE.com to chart out the project structure and schedule.
Specialized project management software like Plaky allows you to:
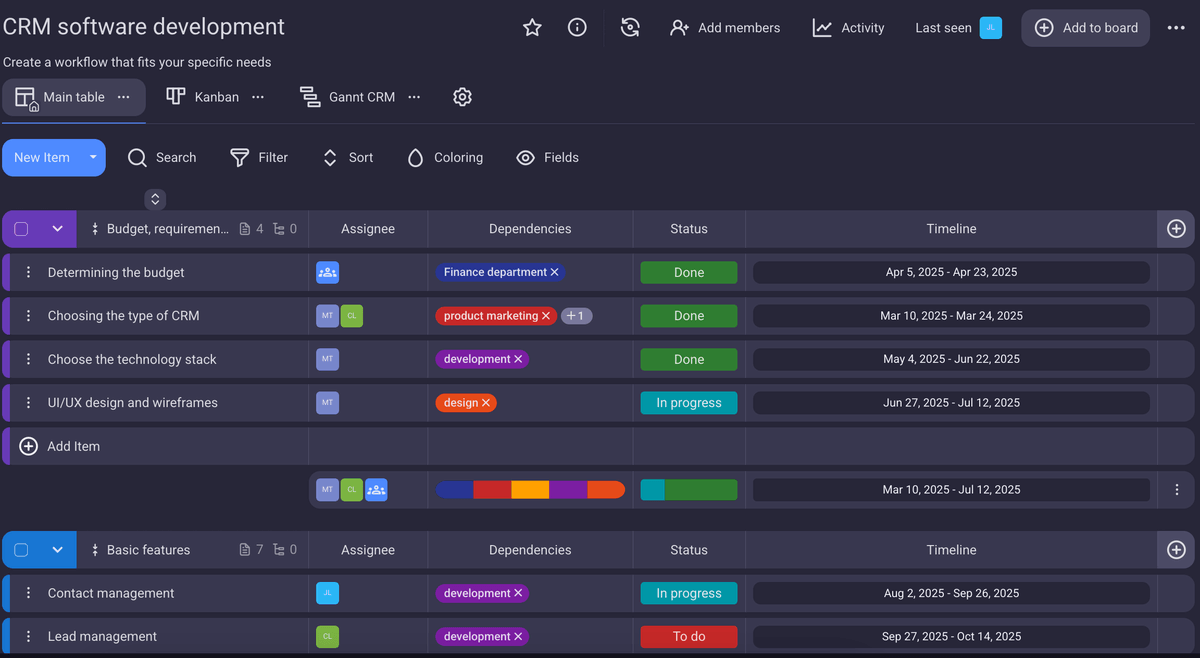
- Have all your project and task information in one place — No need to dig through your inbox or chats to find what you’re looking for. Everything is just a few clicks away.
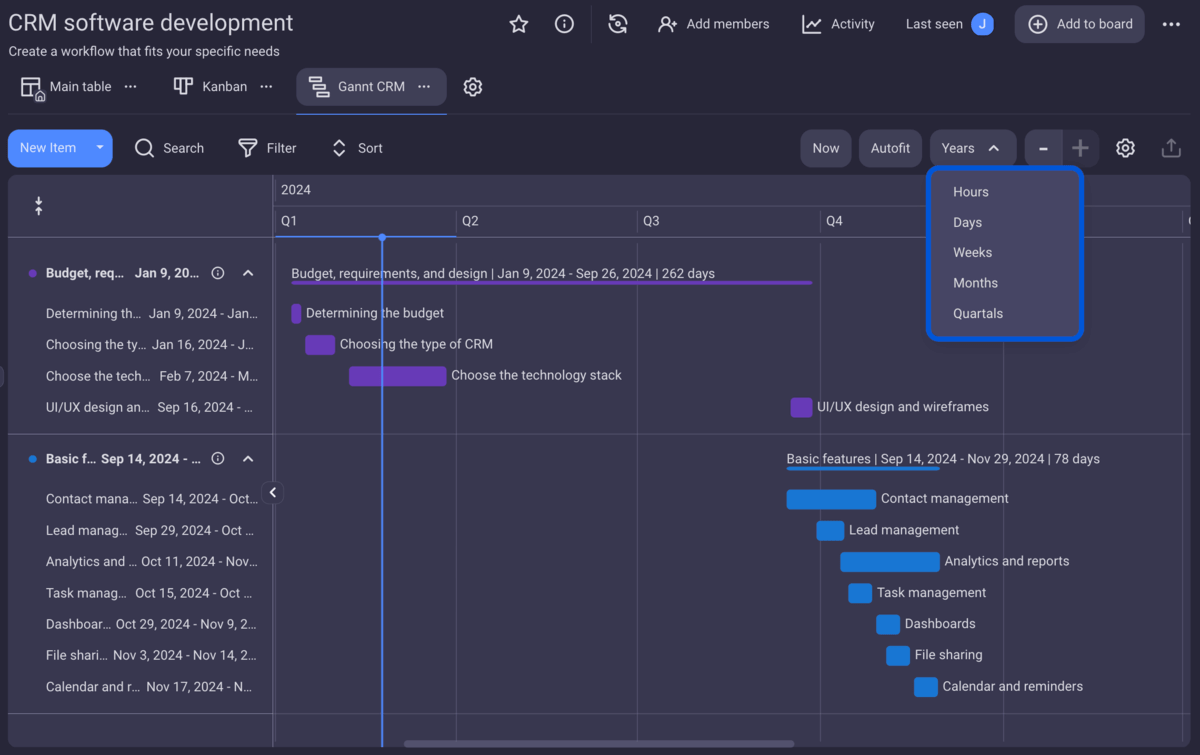
- Use Gantt charts to visualize the schedule and adapt to changes easily — Viewing your upcoming tasks on a timeline can help you arrange and rearrange resources quickly.
- Communicate with your team and share files — Keep communication and documentation centralized and get notified of updates in real time.
- Gain insight into all project activities — Use the comments section to communicate with your team and check the activity log to see the changes made, and
- Set up projects using versatile project templates — Start from scratch or jumpstart your projects in mere seconds with pre-made boards.
Managing projects, tracking progress, and keeping them on schedule is no mission impossible. Don’t waste another moment — start your 14-day trial to try out all Plaky features for free!