Gantt View
Gantt View provides a visual representation of projects and tasks based on their due dates or timelines. Therefore, it can help you understand task durations and manage project deadlines more effectively.
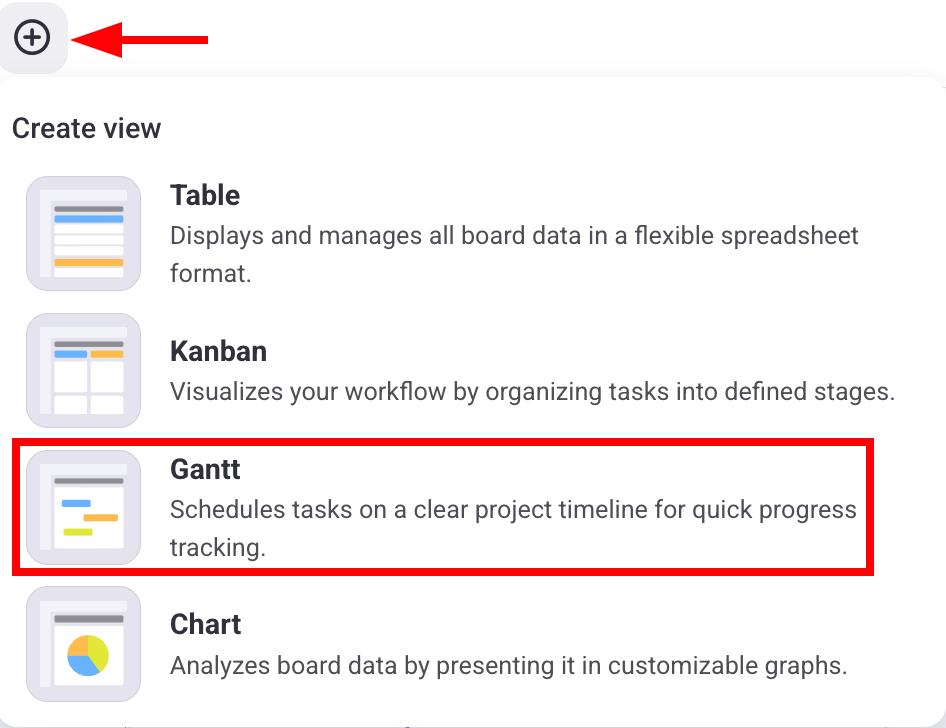
How to create a Gantt View #
To start, you will need to create a Gantt View from your Board. Here’s how you can do this:
- Click on the + button
- Select Gantt
COMING SOON
COMING SOON
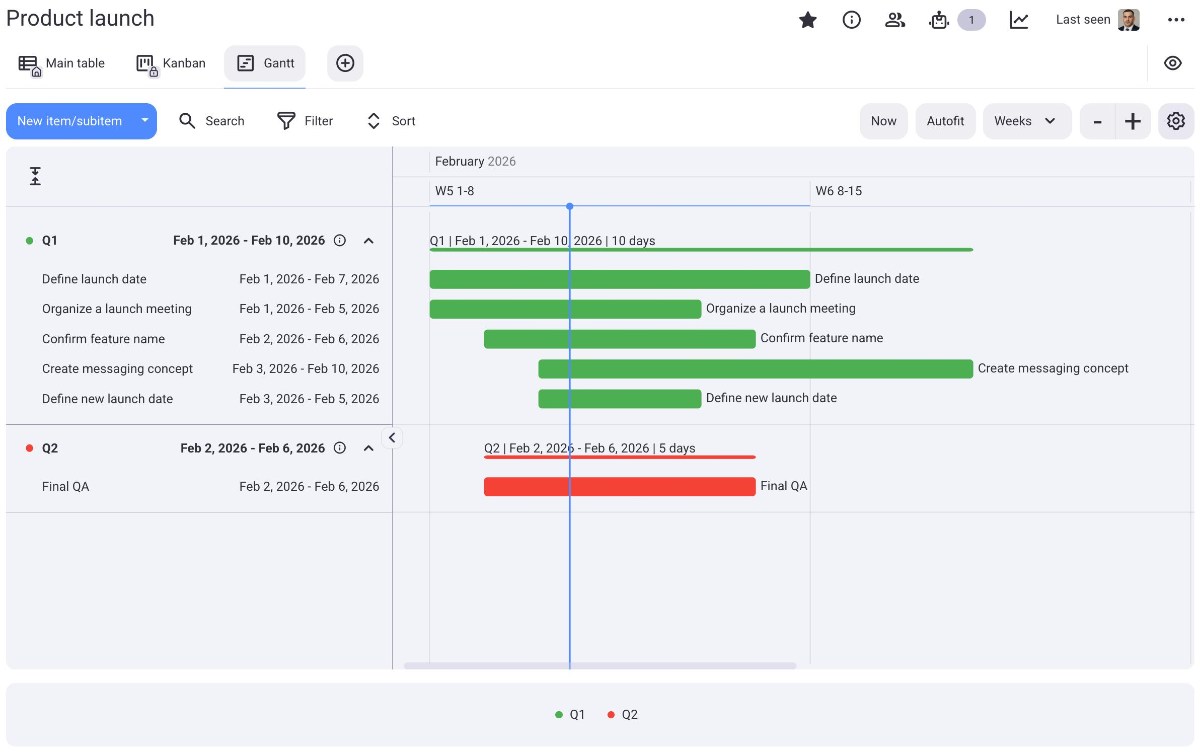
Overview #
When you create a Gantt view, all information will be displayed in two areas:
- Left sidebar
- Central section
Let’s look at these areas in more detail.
Gantt View doesn’t show time ranges for subitems.
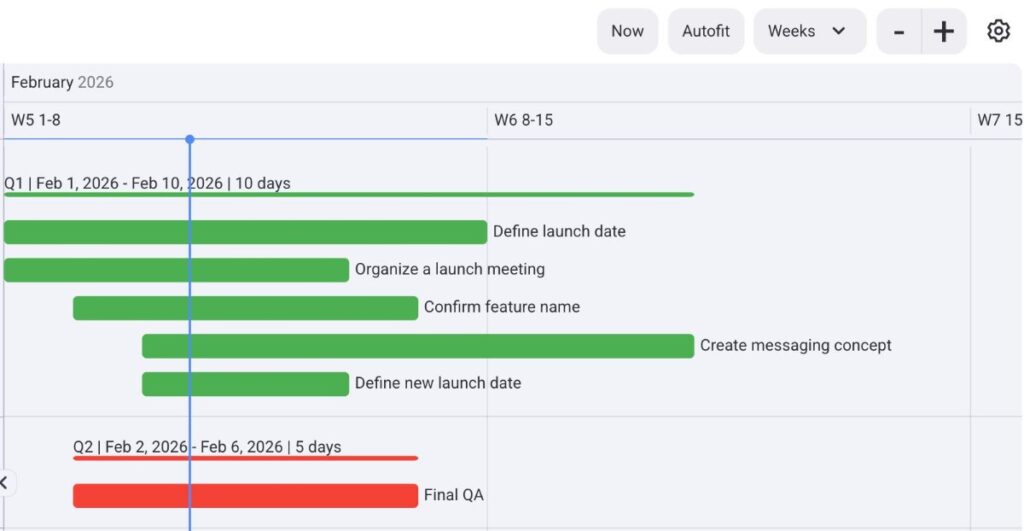
In the left sidebar, all Items that have a value in at least one Gantt field (date or timeline) are displayed. Next to the Item name, a value from the Gantt field is displayed. The items are grouped by Item Group by default.
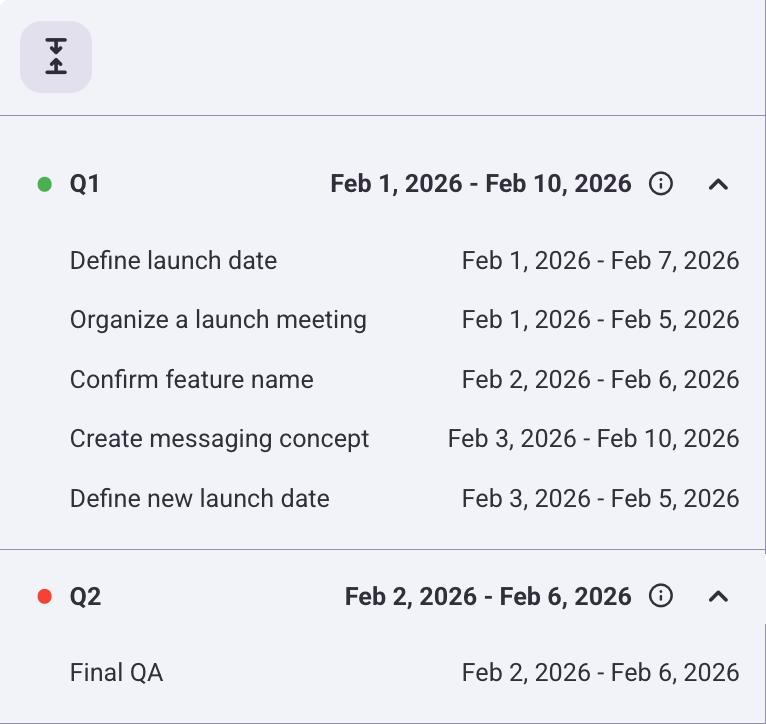
If you select more than one Gantt field, Items will be displayed in more rows. If no Gantt field is chosen, no Item will be displayed in the section field.
In the central section, the Items’ timelines are presented as rectangles. There is an option to customize the time period (day, week, month, quarter, year), with Weeks as the default value. Based on the chosen value, the relevant period is displayed in the Gantt. By clicking the Autofit button, the overview adjusts to fit the timelines within view, and clicking the Now button focuses the overview on today’s date.
The Gantt chart can be zoomed in and out, filtered, sorted, exported, and searched through.
Customize Gantt view settings #
In Gantt view Settings, users can configure which Gantt fields are included in the view, define grouping, coloring, and labeling criteria for Items, and select additional view settings.
Let’s look at this in more detail.
Select Gantt fields #
You can select which Gantt fields are displayed in your View. Here’s how you can do this:
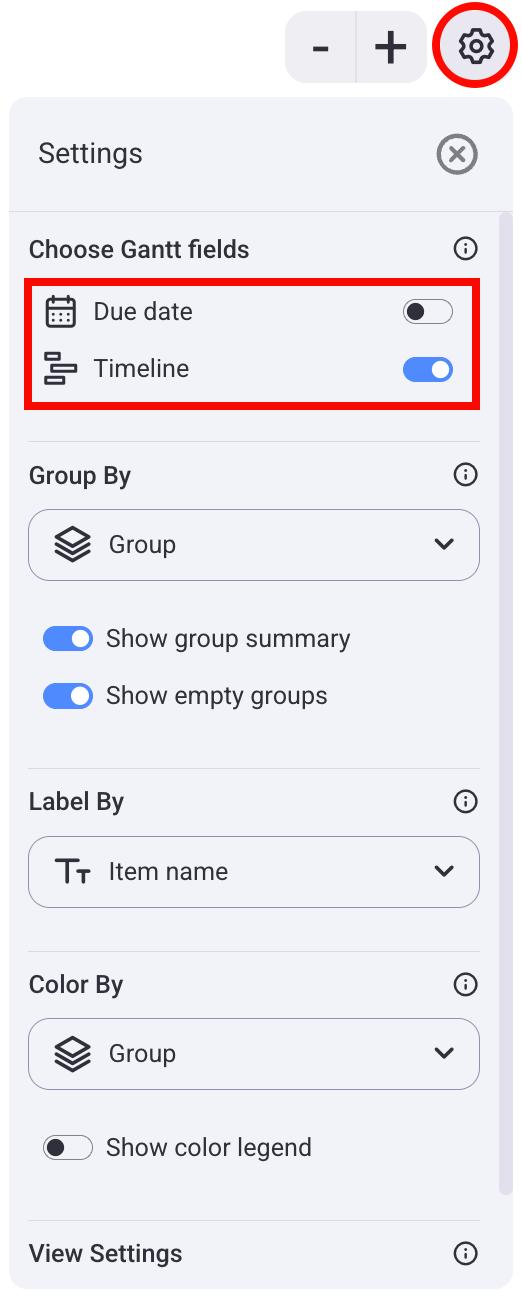
- Click on the gear icon on the right
- Under Choose Gantt fields, toggle the fields you want
Group by #
By default, Items are grouped by Item groups. You can change this setting and choose one of the following ways to group Items:
- Item group
- Status field
- Person
- Tag
- None
If None is selected as a grouping criterion, Items will not be grouped.
Here’s how you can do this:
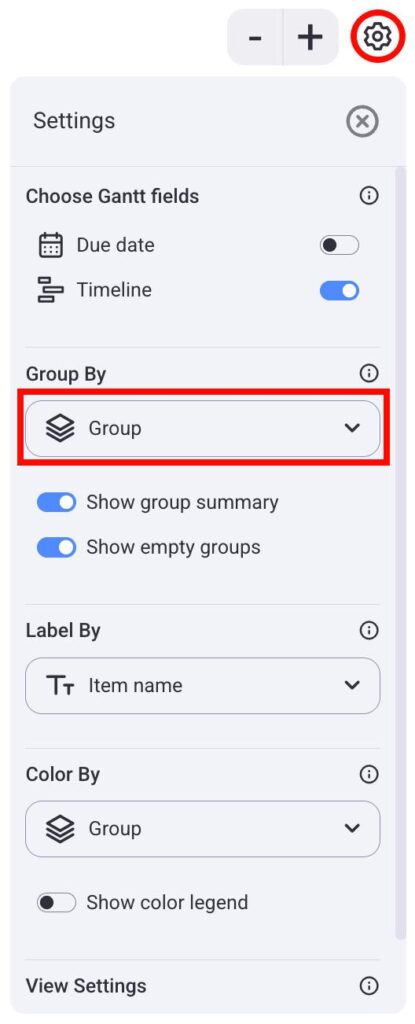
- Click on the gear icon
- Click on the dropdown under Group By
- Select the grouping criterion
Label Items #
By default, tasks in the Gantt chart are named after Item names, and their labels are shown next to the Items. You can select one of the following labels:
- Person
- Status
- Date
- Timeline
- Item Group
- None
The availability of labels for defining criteria depends on the fields present on the Board.
If none is selected, nothing is displayed next to the Item.
Here’s how you can select a label:
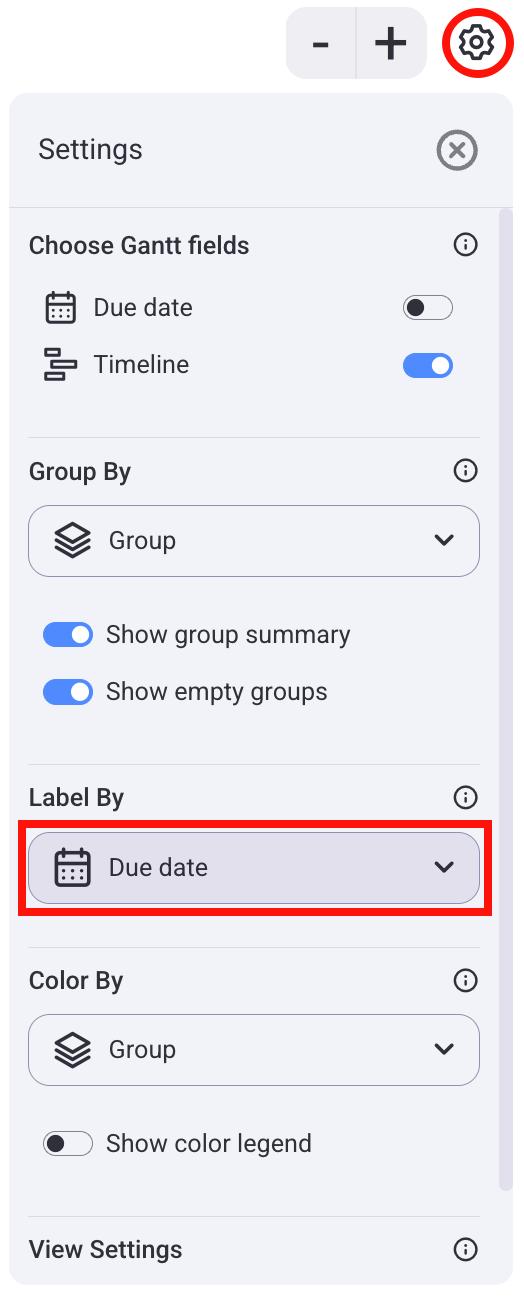
- Click on the gear icon on the right
- Under Label by, click on the dropdown
- Select a label
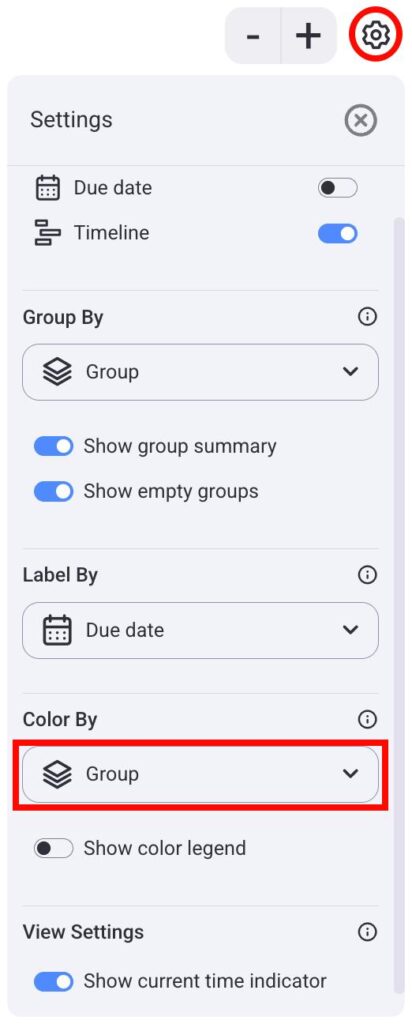
Color by #
Tasks by default have the color of the Item group. You can change the color to match any status field on the Board.
Here’s how you can change the coloring criteria:
- Click on the gear icon on the right
- Under Color by, click on the dropdown
- Select the status field from which you want to inherit color
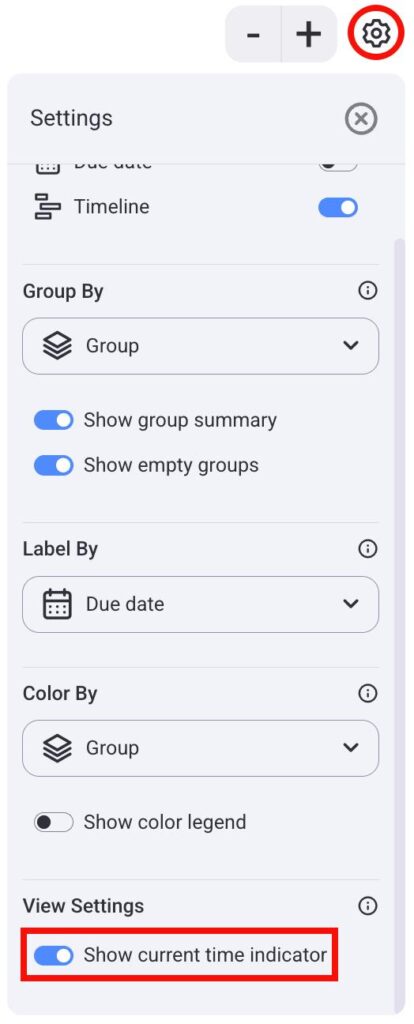
Show the current time indicator #
The current time indicator is displayed as a blue line in your central section. This line displays the current date and shows how much time is left until your project’s deadline.
Here’s how you can turn on/off the time indicator:
- Click on the gear icon on the right
- Under View settings, toggle the button on/off