



Do you use Google Sheets in your daily project management, but have to spend a good portion of your day setting up tables to adapt them to your projects?
All that time that you could’ve spent working on your tasks (or having a cup of coffee) going to waste.
Luckily, we created 20 free Google Sheets templates to help you dive into your project straight away. This collection covers every phase of project management:
- Prioritization
- Planning
- Tracking resources
So, keep reading to find the ones that’ll suit you best.
Why should you use Google Sheets for project management?
Google Sheets is a good tool for project management if you need an organized way to collaborate in real time. It offers deep integration with other Google tools and is completely free for individual users.
Benefits of Google Sheets include:
- Clarity. All the information can be neatly organized in one or several tables, giving you a clean overview of everything.
- Real-time collaboration. You can share your files with your team members, so they can view them, edit content, and leave comments. And, most importantly, you can see all the changes in real time.
- Integration with Google tools. You can keep all Sheets files in your Google Drive together with other business documents, presentations, calendars, etc. for better organization.
- Affordability. Google Sheets is free for individual users. Businesses can get it along with other Google tools at the starting price of $6.30/user/month if paid annually.
And, if you’re deciding whether to use Excel vs. Google Sheets for project management, the answer is simple — use Google Sheets.
While they are similar, Google Sheets is better for real-time collaboration on projects than Excel, since you can easily grant access to your colleagues and invite them to leave comments and suggestions, edit in real time, etc.
Plus, Google Sheets can be accessed on any device with just your email, while you need to have Excel installed to open Excel documents.
What should a fab PM template include?
To be a top-tier asset, a good project management template needs to have:
- A clear title informing you of the template’s purpose
- General information about the project, e.g., project owner, due date, etc.
- A comprehensive list of tasks together with assignees, priority, and status
- Additional information such as resources, budget, client list, goals, depending on the project type and the industry
Now, let’s explore our list of 20 free Google Sheets templates.
#1: Google Sheets dashboard template
Get our Google Sheets dashboard template
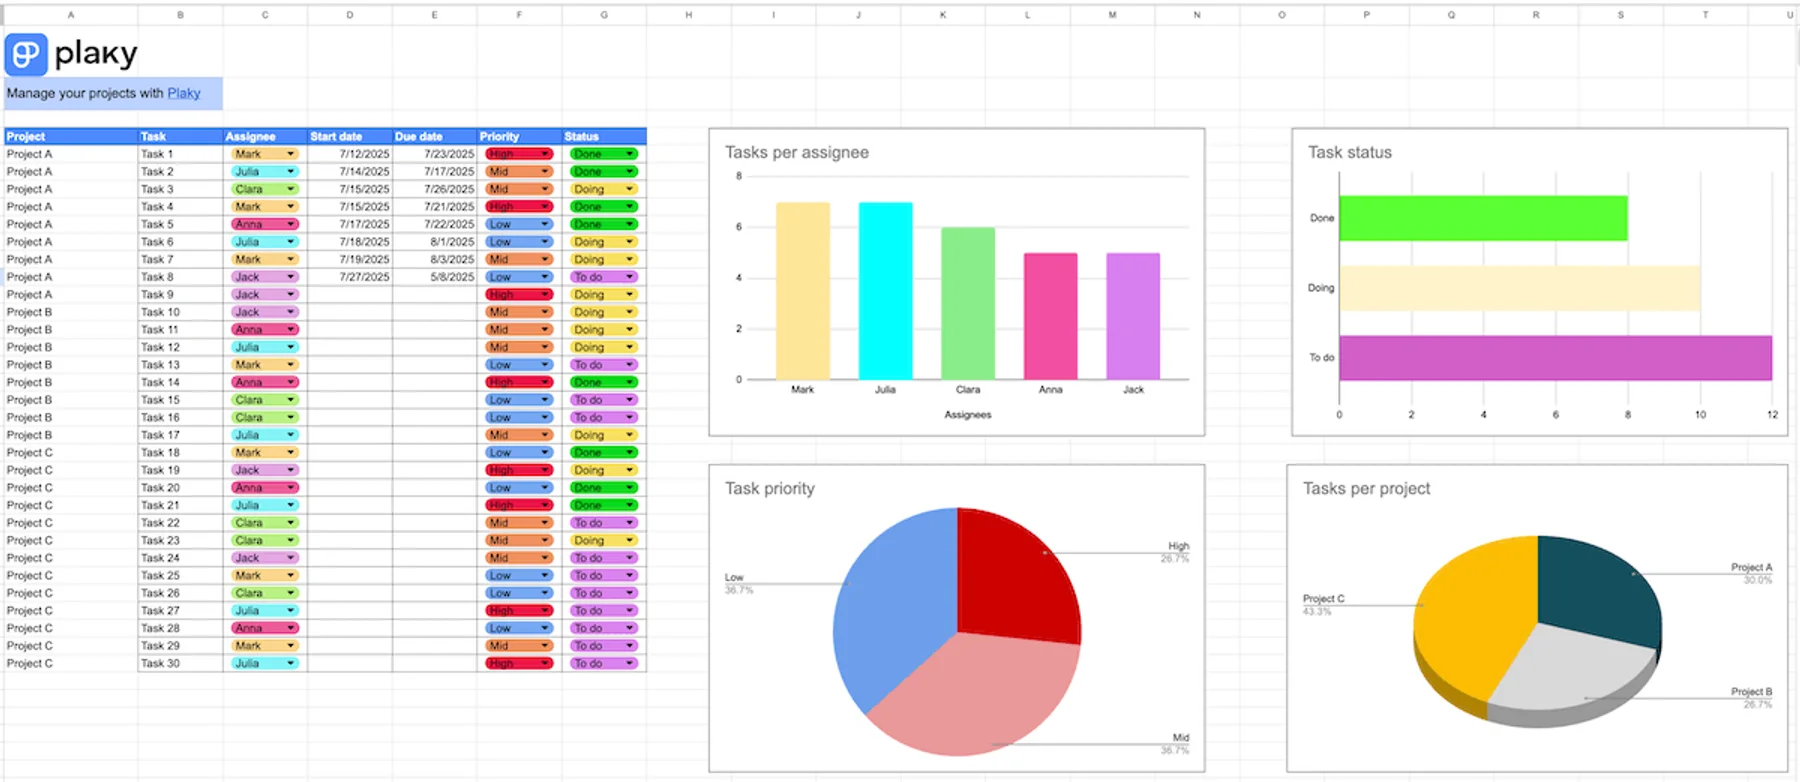
This Google Sheets project management template has built-in dashboard formulas. You just enter your data into the table, and the dashboards update automatically. The real value is understanding how these formulas work, so you can extend the dashboard, add rows without breaking it, and adapt it further to your own data.
This Google Sheets dashboard template includes:
- Tasks per assignee — a bar chart showing how many tasks are assigned to each team member.
- Task status — a horizontal bar chart showing the number of tasks in each status, such as To do, Doing, and Done.
- Task priority — a pie chart showing the percentage of tasks marked High, Mid, or Low priority.
- Tasks per project — a pie chart showing how the total number of tasks is distributed across projects.
Overall, this template is best for having a visual representation of project information, such as status, priority, and workload distribution.
Create customizable charts in Plaky
💡PLAKY PRO TIP
If you need help creating a dashboard in Google Sheets, take a look at our guide:
#2: Simple Google Sheets project management template
Get our simple Google Sheets PM template
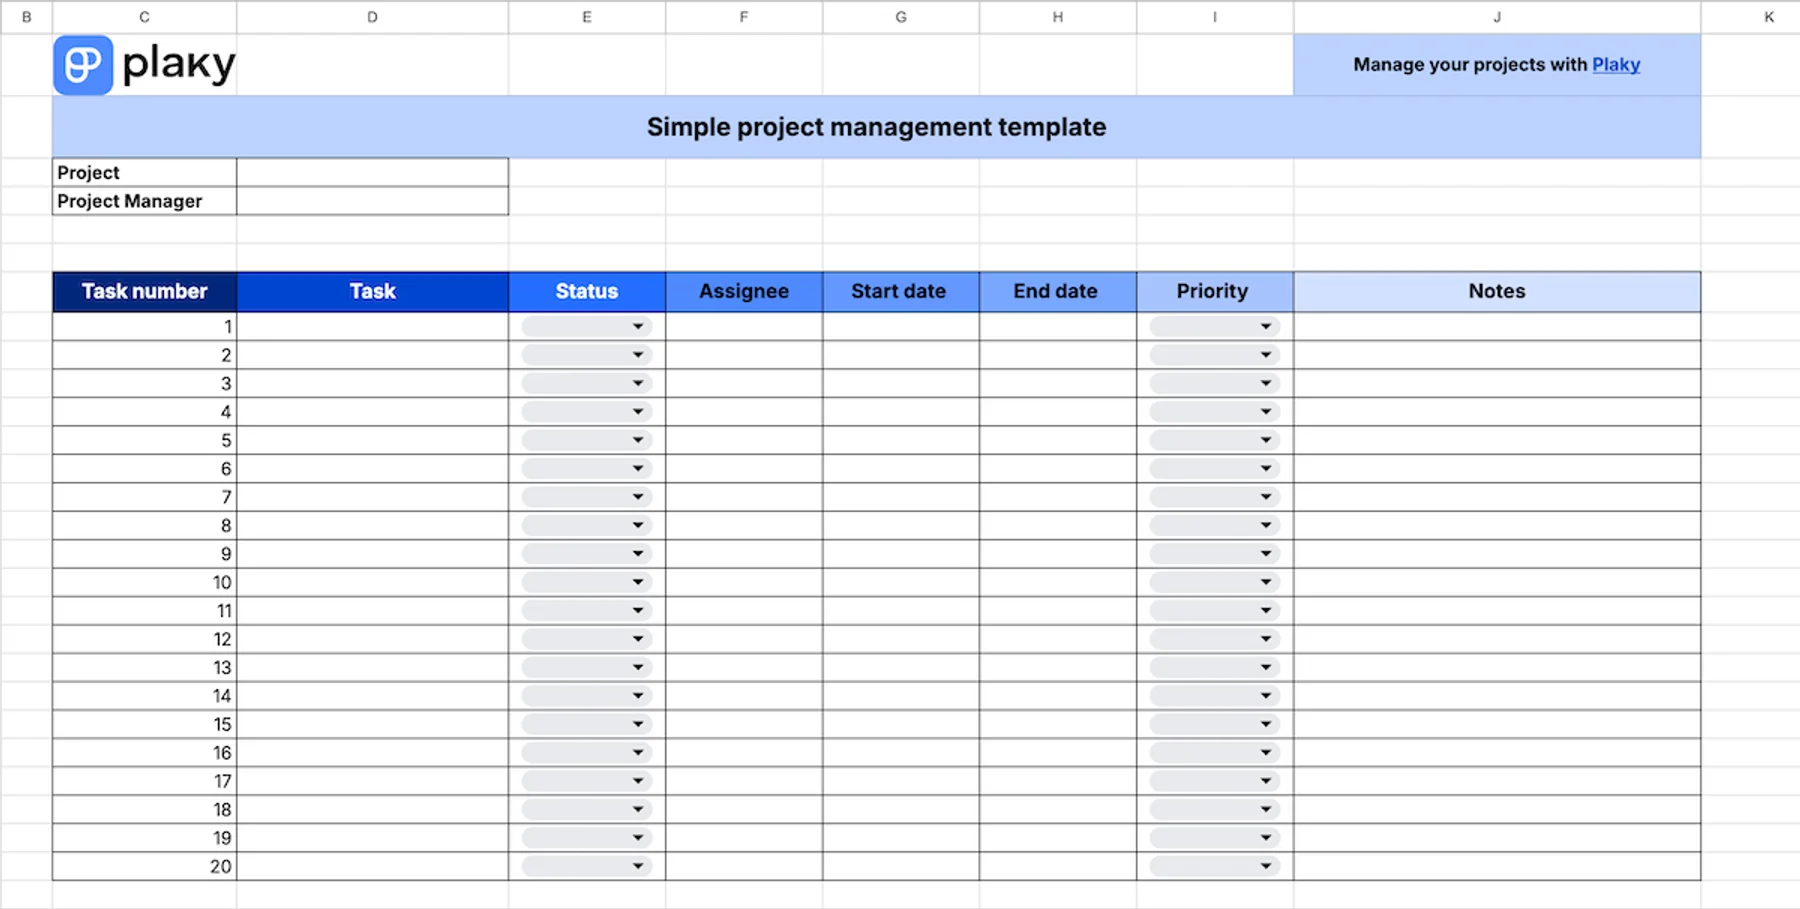
This simple Google Sheets template allows you to track the most important information about your tasks, like:
- Status
- Assignee
- Start and end dates
- Priority
There’s also space for your notes, so you can add any additional information necessary and leave instructions to people assigned to tasks.
In general, this template is best for project managers who are looking for basic project tracking and don’t need any visual tools, like Gantt charts or dashboards.
#3: Google Sheets project plan template
Get our Google Sheets project plan template
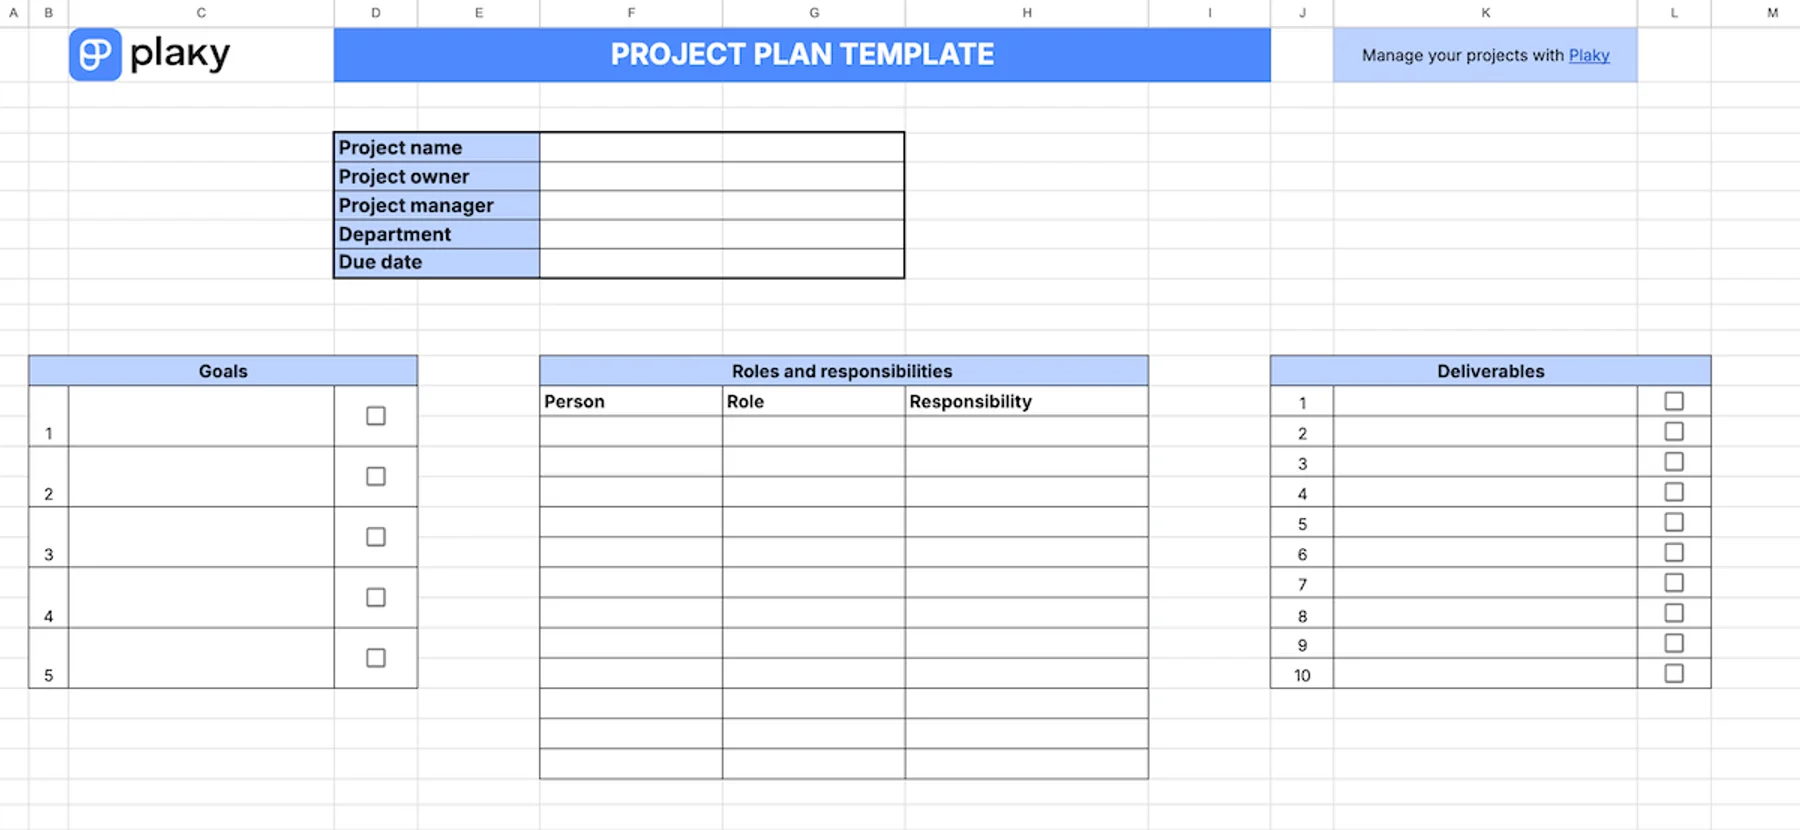
This project plan template helps you plan all the most important aspects of your project before you actually start working on it. It serves as a visual representation of your project management plan and consists of 4 tables:
- General information (project name, owner, manager, etc.)
- List of project goals with a checklist
- Record of everyone working on the project and their assigned roles and responsibilities
- List of deliverables with a checklist
This project plan template is best for creating plans for large projects that need to be meticulously organized and tracked.
#4: Google Sheets RACI template
Get our Google Sheets RACI template
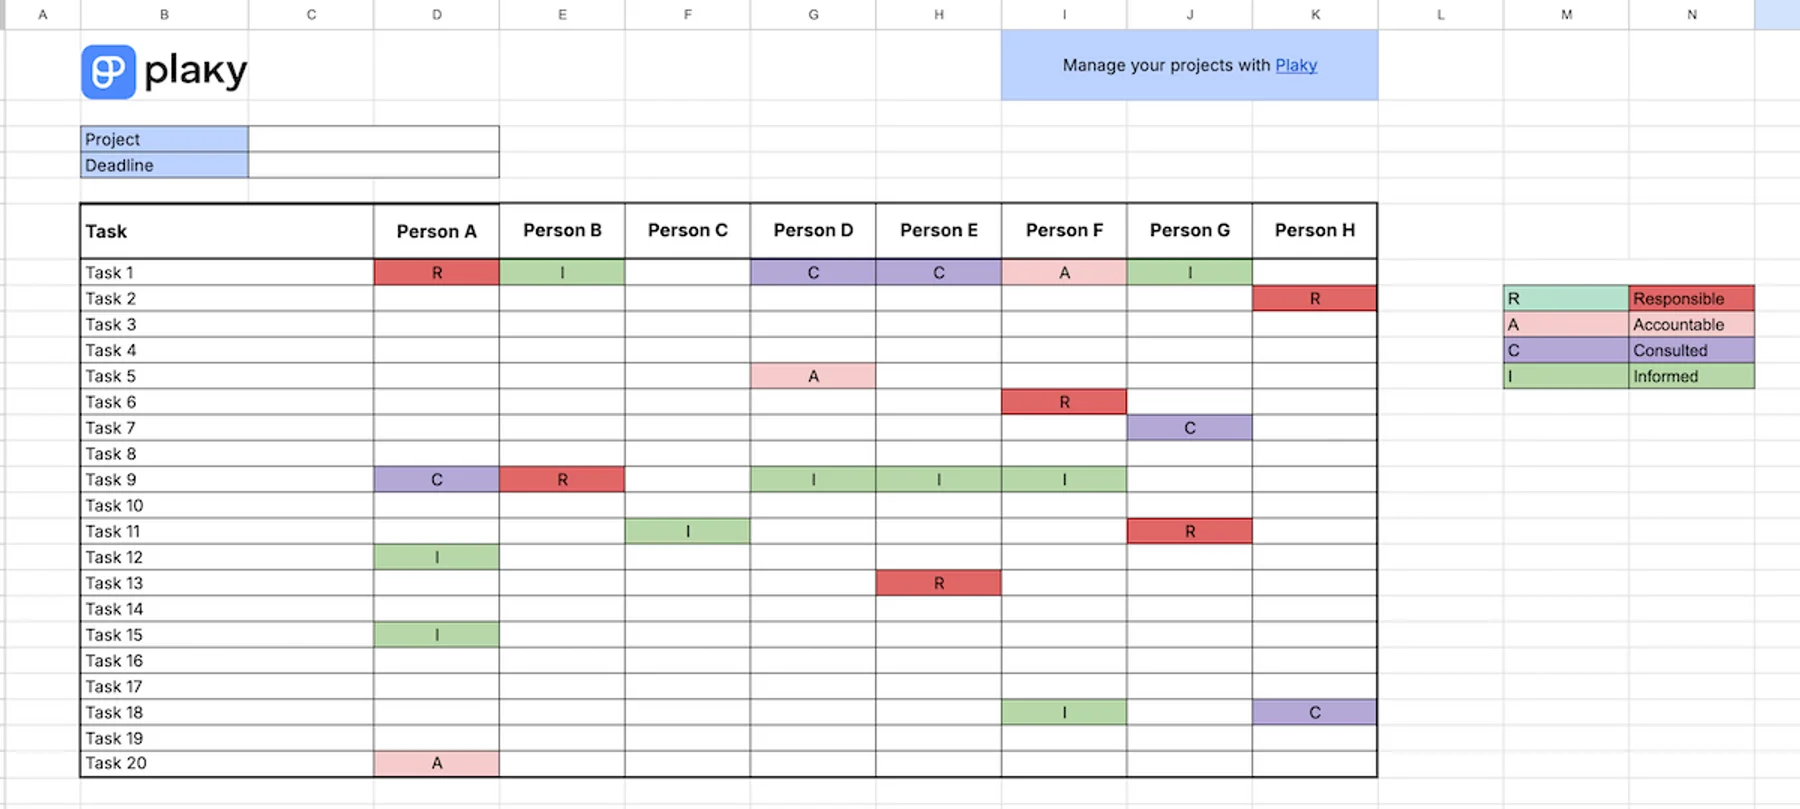
This Google Sheets template is based on the RACI matrix, which is used to determine everyone’s responsibility in the project. The template is in the form of a table, in which rows represent project tasks, while columns mark all employees involved in that project.
Since one person can work on multiple tasks, but in different capacities, the RACI system provides a clean and color-coded overview of all team members and stakeholders’ involvement in specific tasks. It recognizes 4 levels of obligation:
- R — Responsible
- A — Accountable
- C — Consulted
- I — Informed
Our RACI template is best for tracking everyone’s role in a project. It helps you track who is responsible and accountable for tasks, who needs to be available for consultations if necessary, and who should be informed of task progress.
#5: Google Sheets resource management template
Get our Google Sheets resource management template
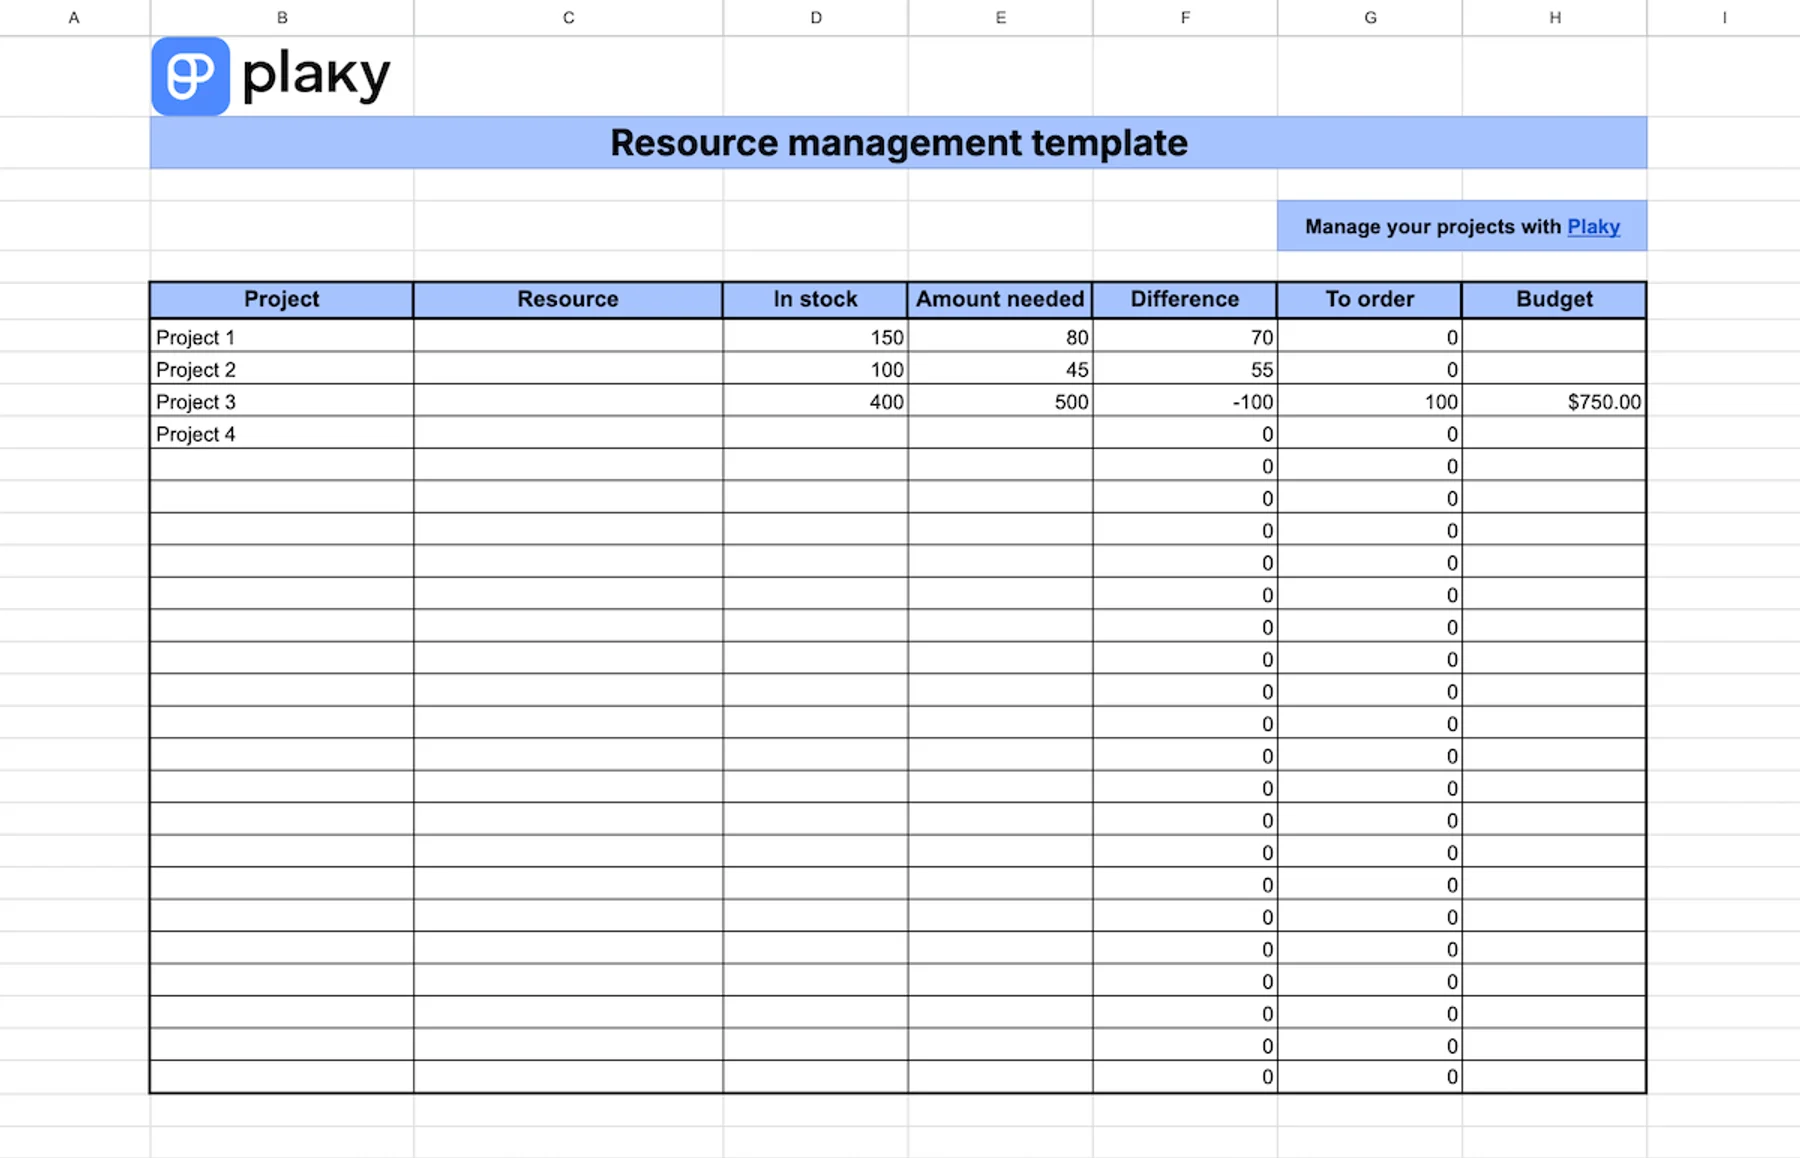
This template is intended for managing your resources across different projects. Here, you can track the most important information concerning your resources, such as:
- The amount/quantity you have in stock
- How much of each resource you actually need
- The amount you have to order
You can also track how much money you have to set aside for each resource, which lets you keep an eye on your spending. Ultimately, this helps you stay within your designated budget and avoid cost overruns.
Resource management templates are best for projects in the construction and manufacturing industry since those involve a large number of different resources. But they can be useful to anyone who needs to meticulously plan out their project assets.
💡Dica profissional do Plaky
Looking for the best construction project management templates? We have the solution for you:
Plan your resources with Plaky
#6: Google Sheets action plan template
Get our Google Sheets action plan template
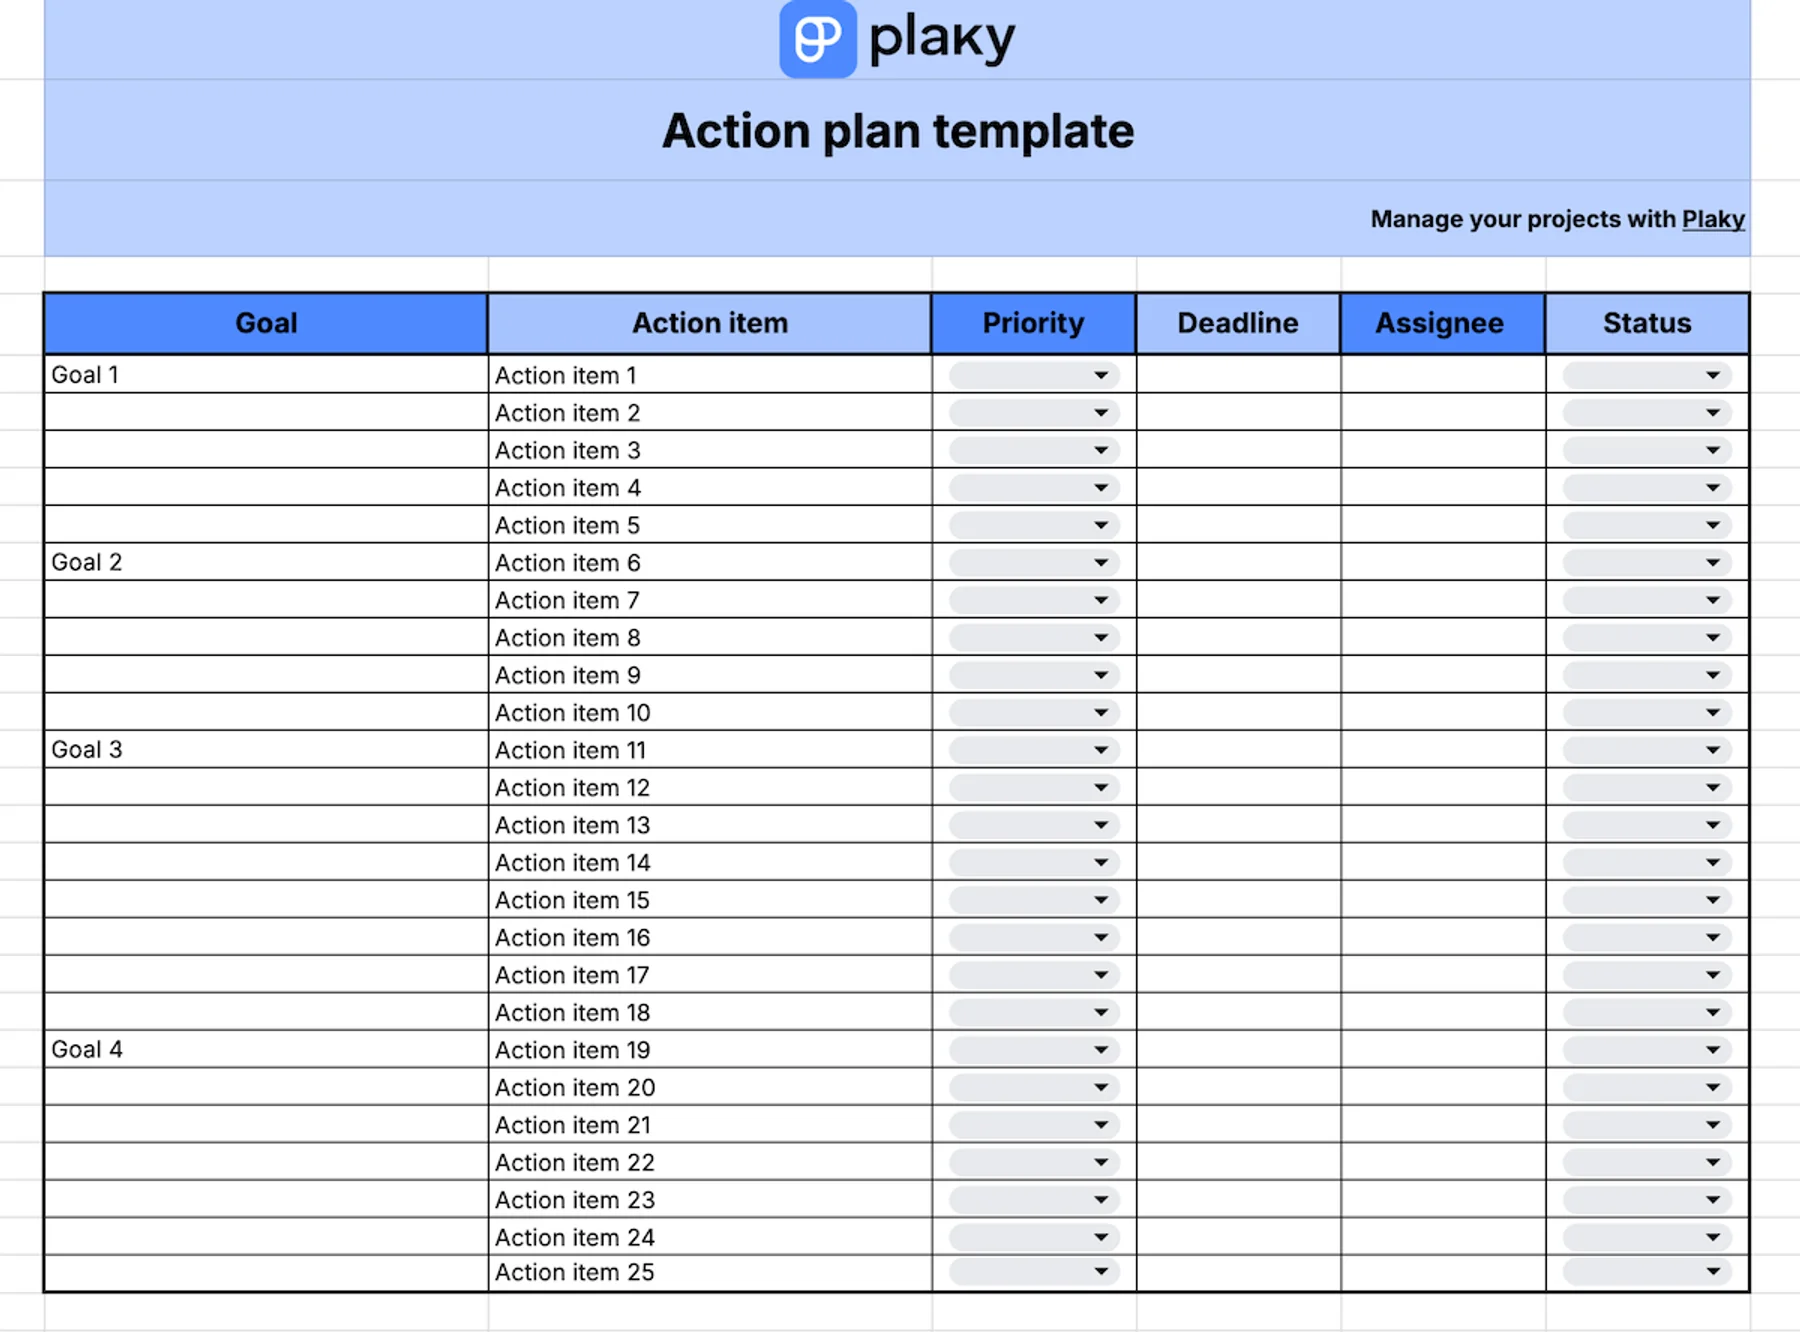
This template is designed to help you align your action items (tasks) with your project goals. This way, you can make sure that each action you take is going to contribute to achieving your goals, and you’re not wasting time on meaningless quests.
Besides connecting tasks to goals, this template also helps you track the priority and status of your tasks and keep an eye on the deadlines.
Our Google Sheets action plan template is best suited for project managers who struggle with visualizing what they need to do to accomplish their goals.
💡 Dica profissional do Plaky
If you want more detailed action plan templates, you’ll find 10 neatly designed options here:
#7: Google Sheets work breakdown structure (WBS) template
Get our Google Sheets WBS template
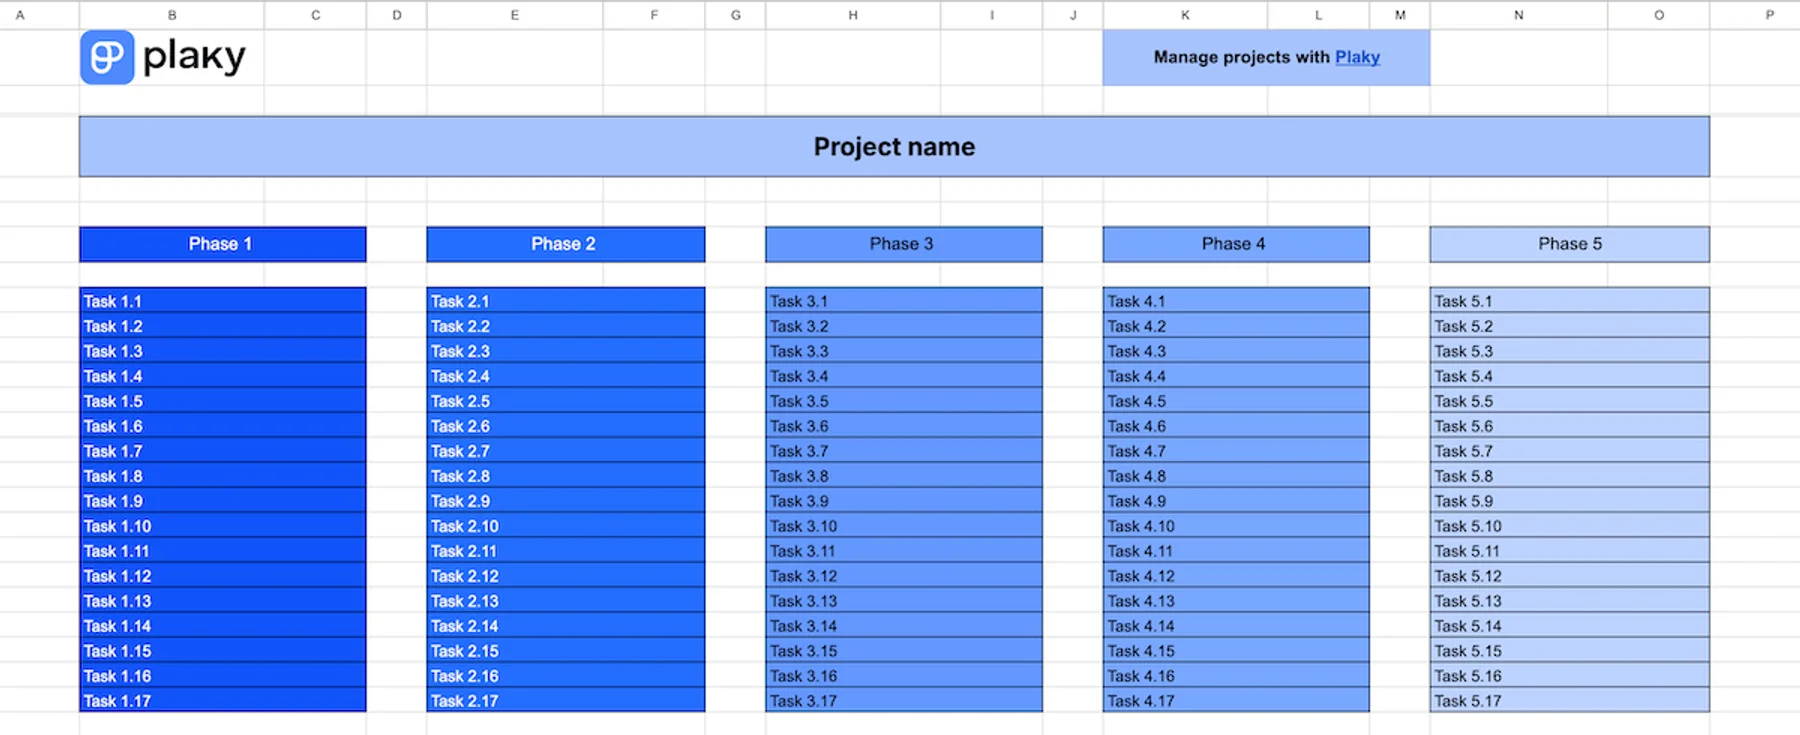
Our work breakdown structure (WBS) template is used to deconstruct the entire project during the planning stage. This, in turn, helps you create project schedules and identify potential risks and dependencies.
This template consists of 2 diagrams, based on 2 types of work breakdown structures in project management — phase-oriented and deliverable-oriented.
In the first, the project is divided into project phases, and then each phase is divided into tasks. In the second, it’s broken down into deliverables, followed by tasks and subtasks.
The WBS template is best suited for project managers who need to structure and plan out complex projects. Essentially, it helps simplify huge projects, enabling managers to create more precise project schedules.
#8: Google Sheets Gantt chart template
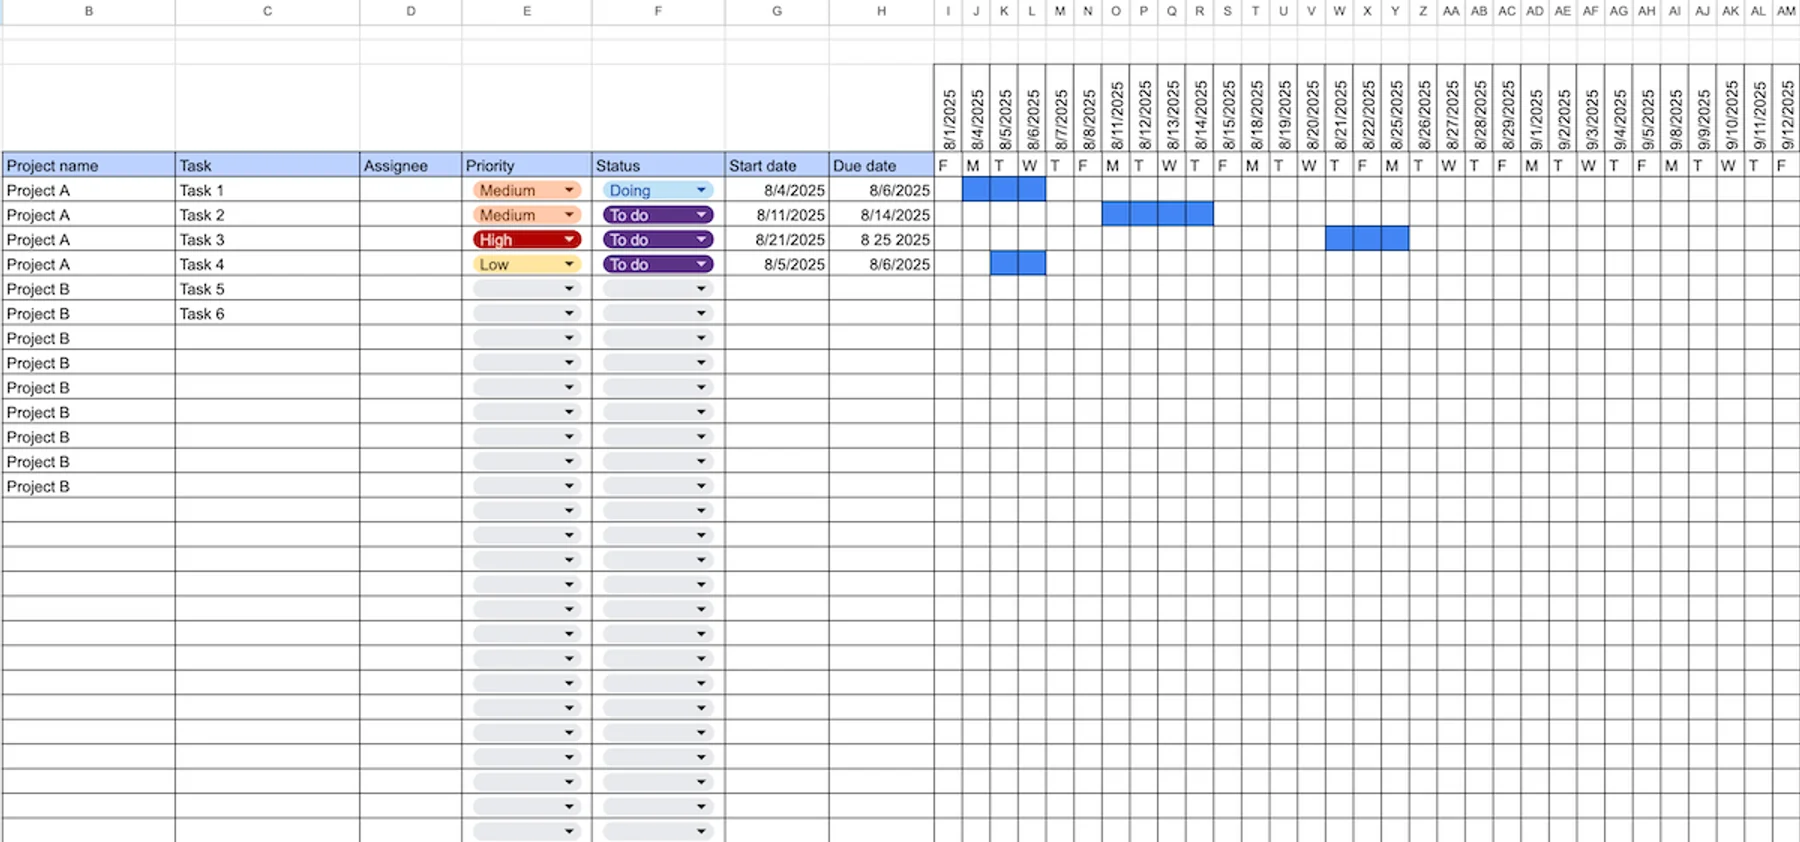
Get our Google Sheets Gantt chart template
If you need to create Gantt charts in Google Sheets without the complex formulas, this template can help you — everything is already set up, so all you have to do is enter information about your project.
In the left part of the template is a table with relevant data, like:
- Project name
- Tasks
- Assignees
- Priority level
- Status
- Start and due dates
And on the right side is a generated Gantt chart that shows all your tasks on a timeline. Once you enter the start and due dates, the task will automatically appear in the chart.
This Google Sheets Gantt chart template is best for visualizing task timelines and ensuring there are no overlaps or potential bottlenecks.
Create detailed Gantt charts in Plaky
#9: Google Sheets risk management template
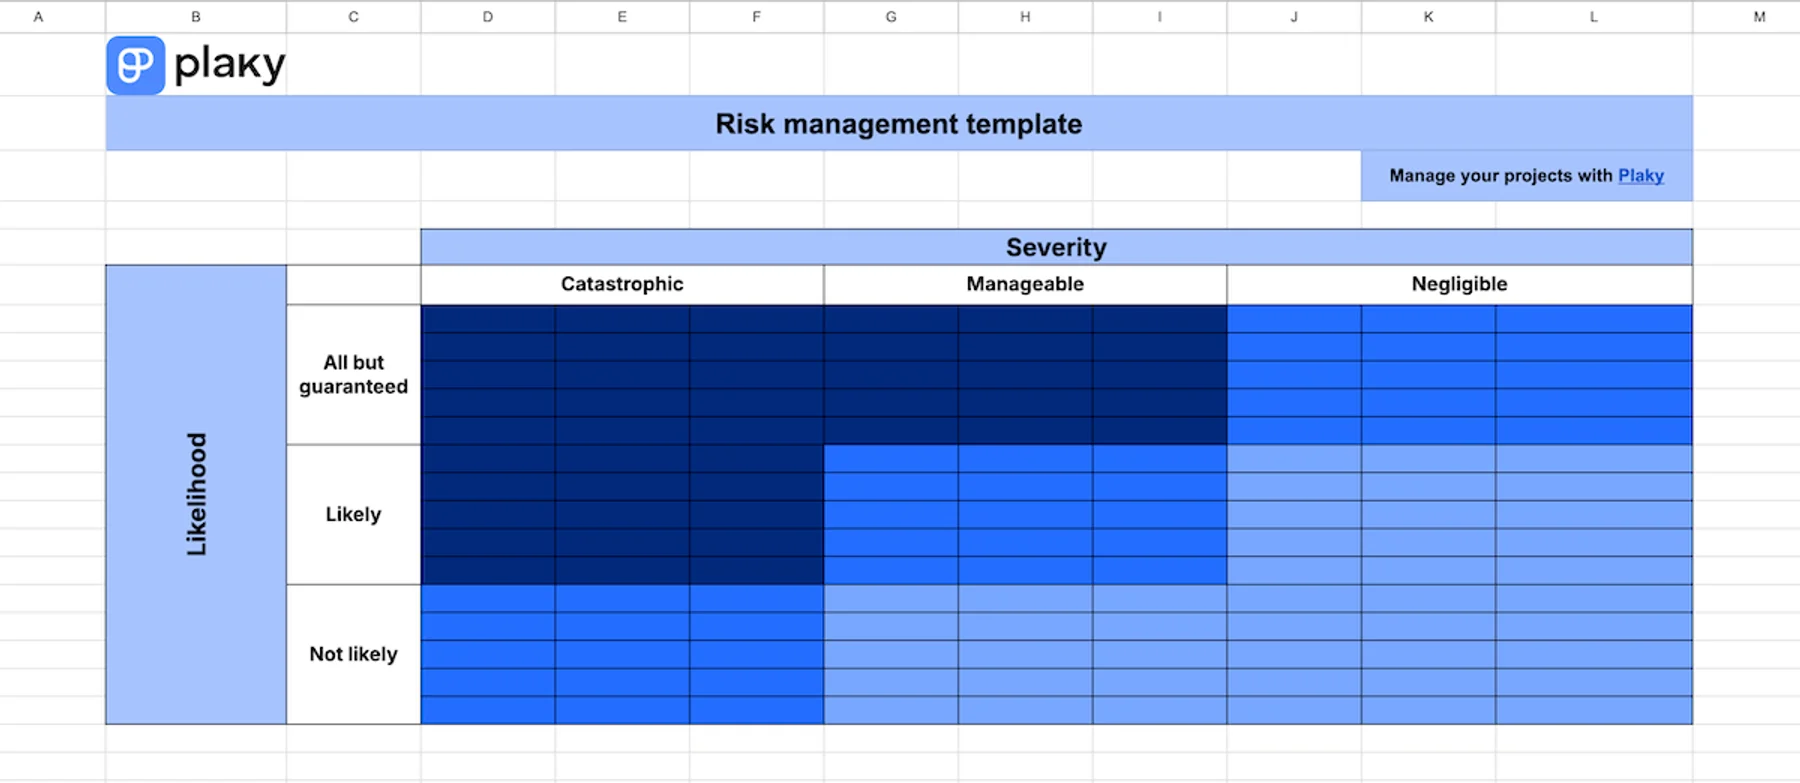
Get our Google Sheets risk management template
This template is based on the risk-priority matrix — a popular project prioritization framework that evaluates projects risks according to 2 criteria:
- Severity (catastrophic, manageable, and negligible)
- Likelihood (all but guaranteed, likely, and not likely)
Depending on where the project risk ranks in both these criteria, you can calculate the level of risk priority — high, medium, or low.
This risk management template is best for identifying and classifying potential risks across the entire company. If used properly, it could help you make strategic decisions and prioritize work accordingly.
#10: Google Sheets project timeline template
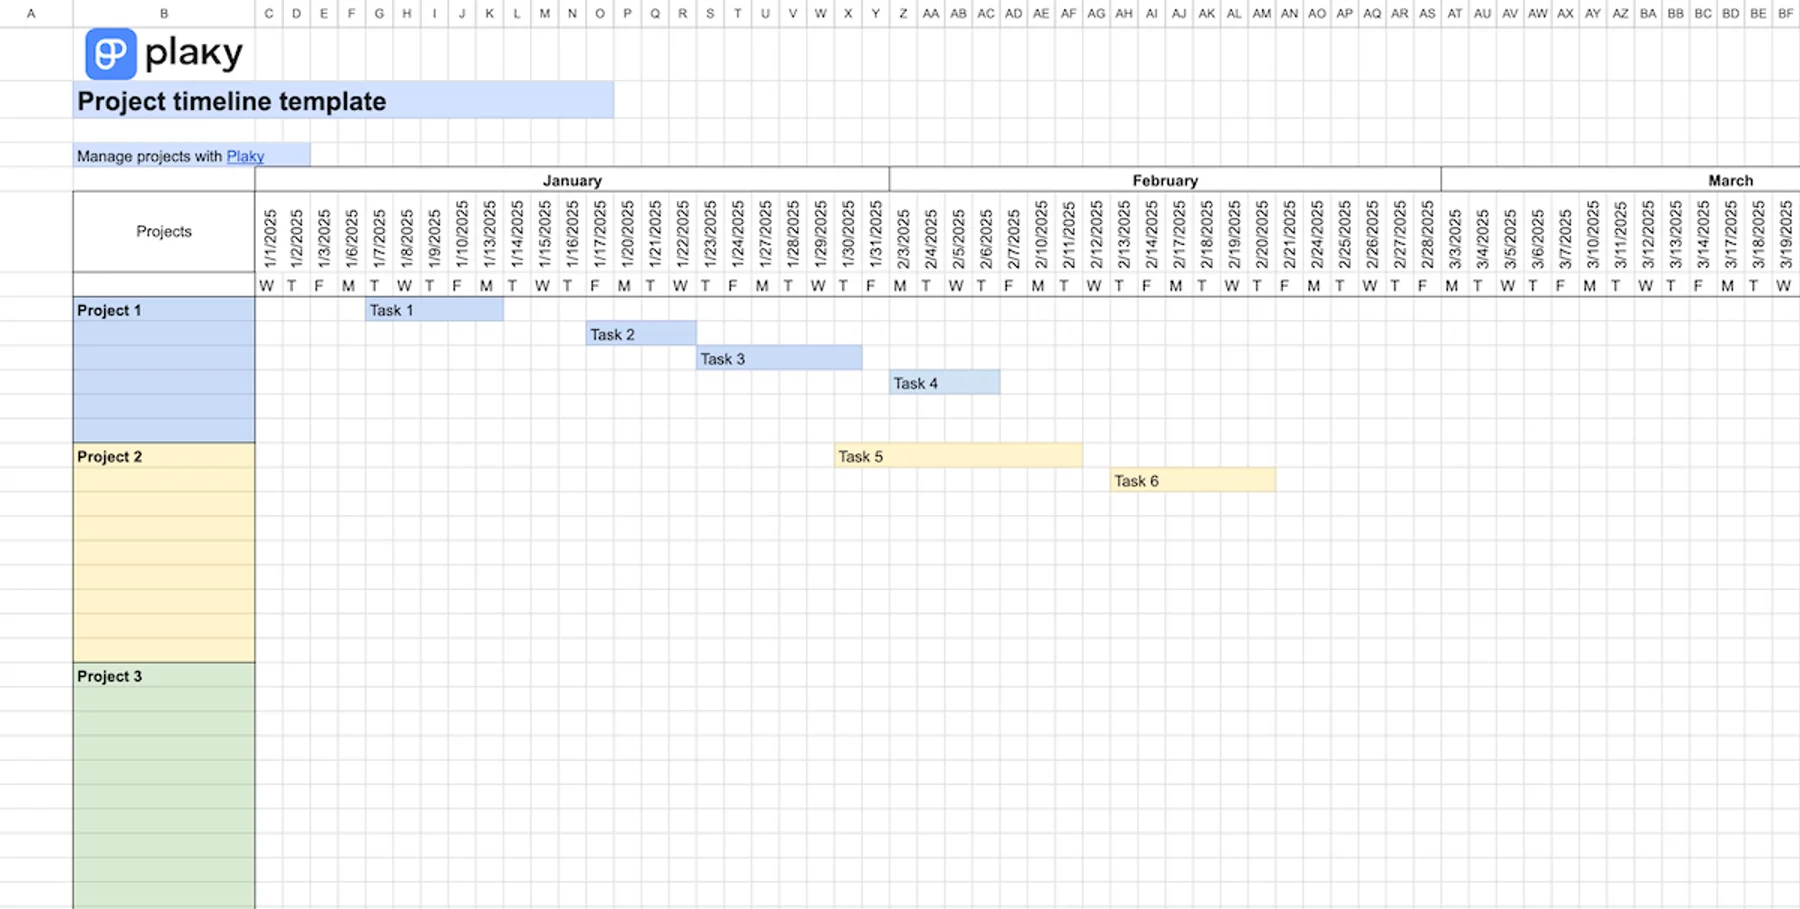
Get our Google Sheets project timeline template
Our project timeline template lets you organize your projects across the span of an entire year. All you need to do is mark the section on the timeline for each project task and color it. Every project is labeled with different colors to help you differentiate tasks across the timeline.
This Google Sheets project timeline template is best for making annual plans for your business. Once you see all your projects on the same timeline, you can check if there are overlaps and shuffle your projects and tasks around.
#11: Google Sheets objectives and key results template
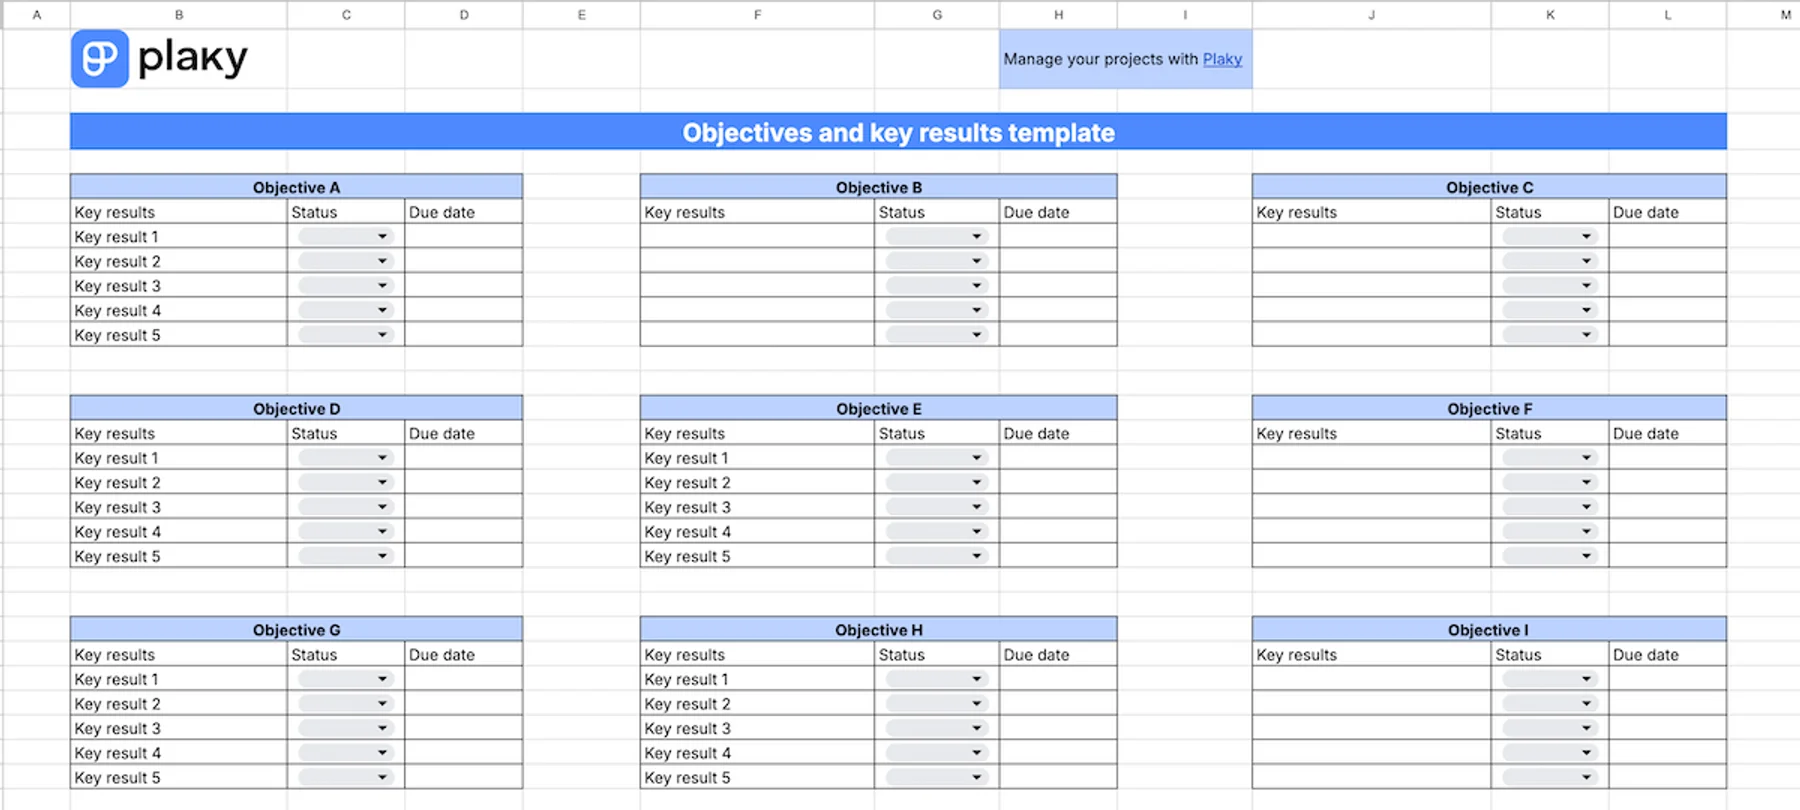
Get our Google Sheets OKR template
This Google Sheets template lets you track all your project objectives and the key results necessary to achieve them. Each objective has a separate table where you can monitor the status and due dates for its key results.
Just pay attention that objectives are qualitative goals you want to achieve, while key results are measurable indicators of whether you’re on the way to achieving your objectives or not.
For example, an objective can be “We want to raise brand awareness among Gen Z”. Key results for this could be:“Reach 150,000 followers on TikTok and Instagram, respectively” and “Get 100,000 product ad views on YouTube”.
This OKR template is best for those who want to improve their strategic planning and ensure they have clear indicators of success for everything they want to accomplish.
💡 Dica profissional do Plaky
If you need more variations of OKR templates or you’d like to track your OKRs in other template formats, check out our article:
#12: Google Sheets content calendar template
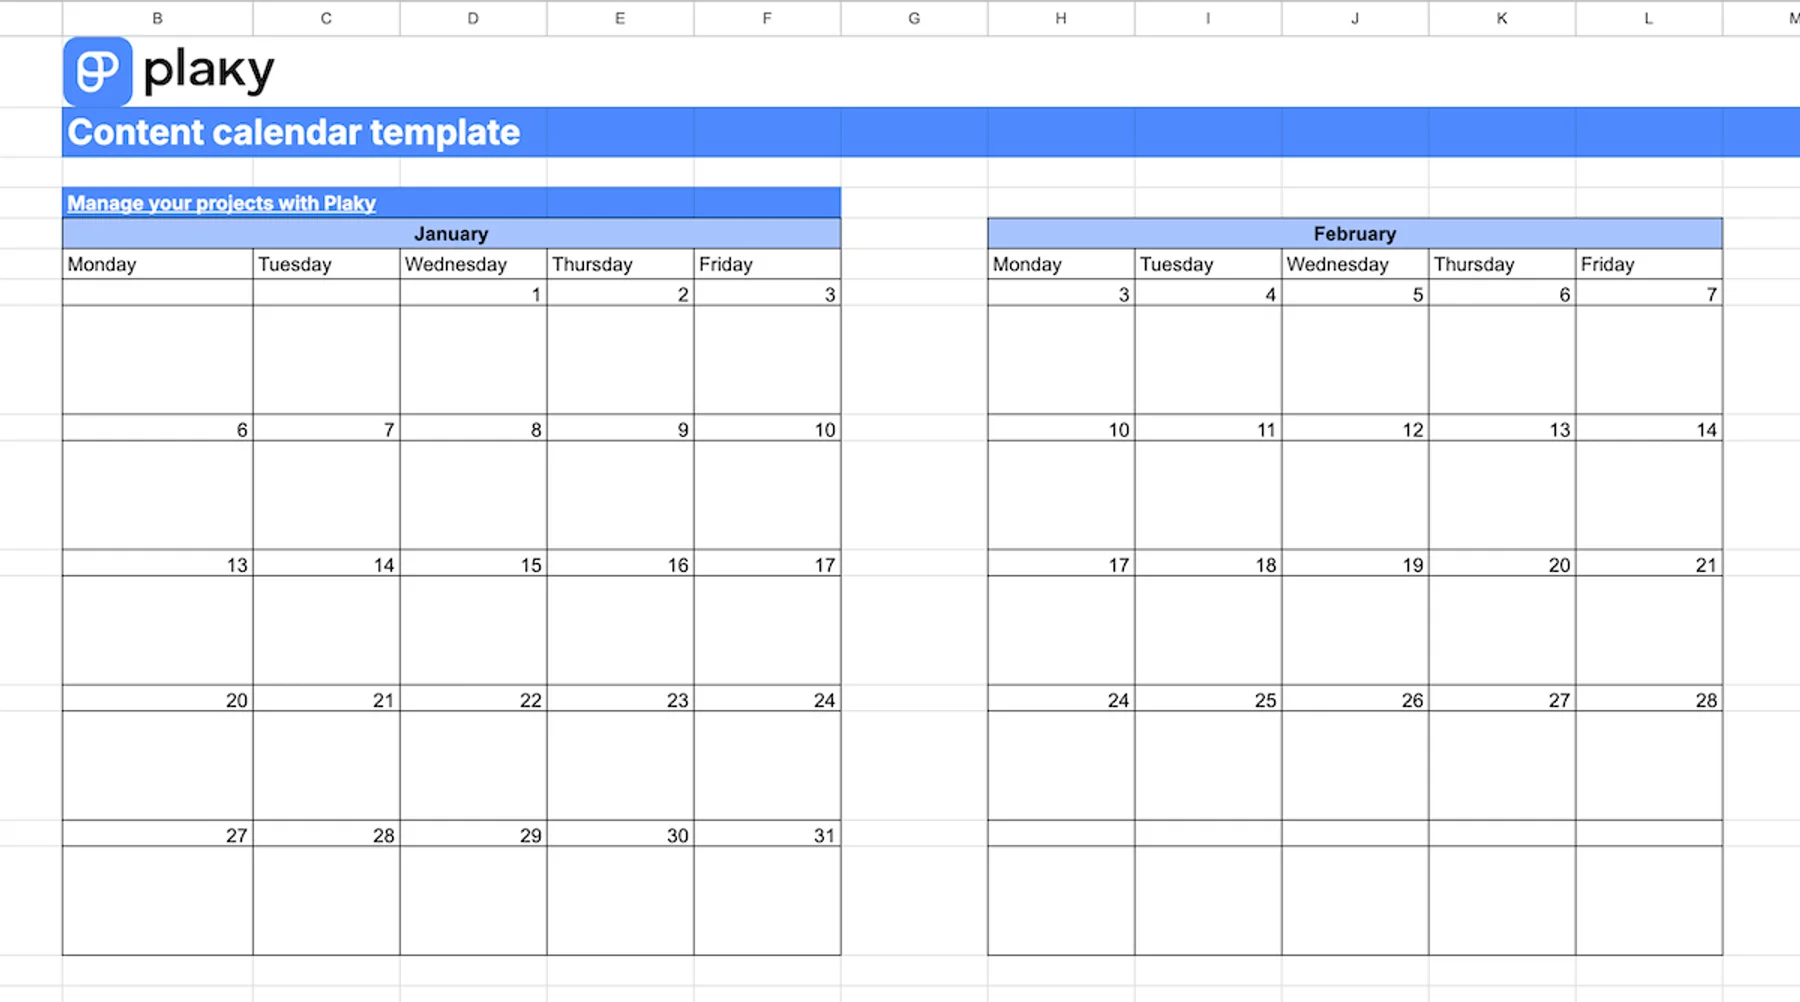
Get our Google Sheets content calendar template
This content calendar template lets you organize your content plans across the entire year. Each month has its own table, so you can write all your content-related tasks under the appropriate date.
This way, you can precisely track when you need to finish each piece of content and when it needs to be published.
Our Google Sheets content calendar template is best for creating a schedule for sharing your content on social media and other channels.

#13: Google Sheets event planning template
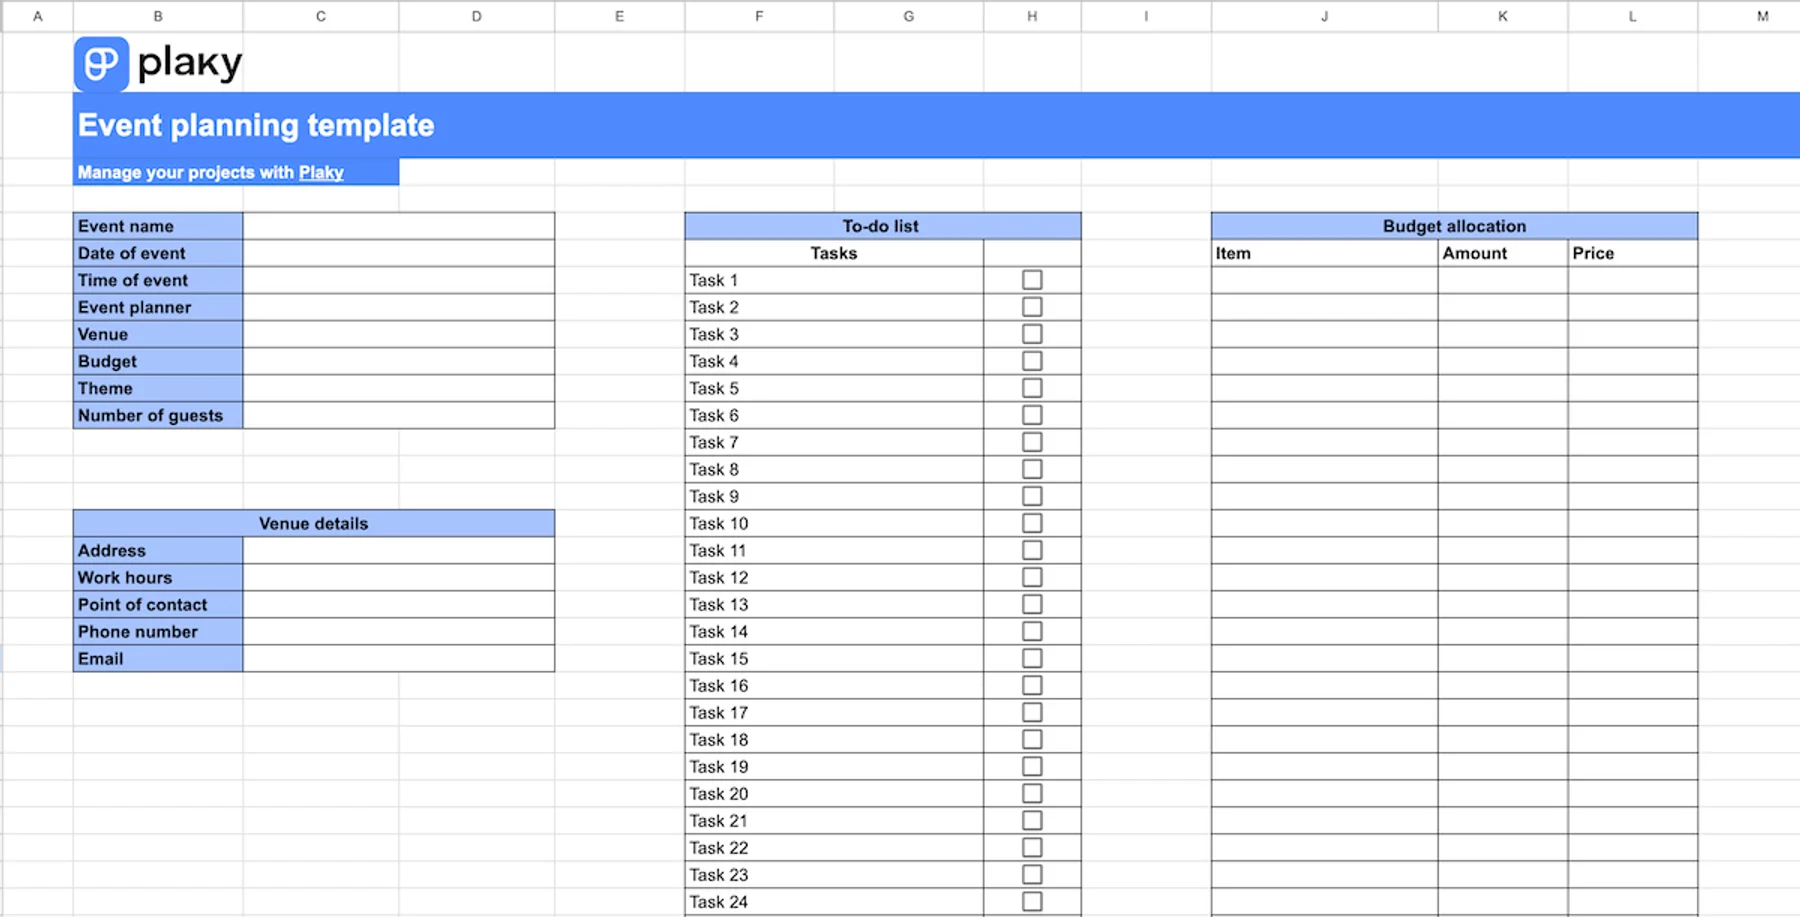
Get our Google Sheets event planning template
This event planning template is designed to help keep all information about upcoming events in one place, neatly organized into tables.
In this template you’ll find:
- General information about the event (time, place, organizer, etc.)
- Venue details (address, contact information, and work hours)
- To-do checklist
- Budget allocation
- Guest list with contact information
Our event planning template is best suited for teams in charge of organizing company events. But it can be used for personal events as well, such as birthday parties, weddings, etc.
Since organizing events can easily become chaotic, this template ensures you won’t lose track of what needs to be done or misplace important information.
Simplify event planning with Plaky
#14: Google Sheets task management template
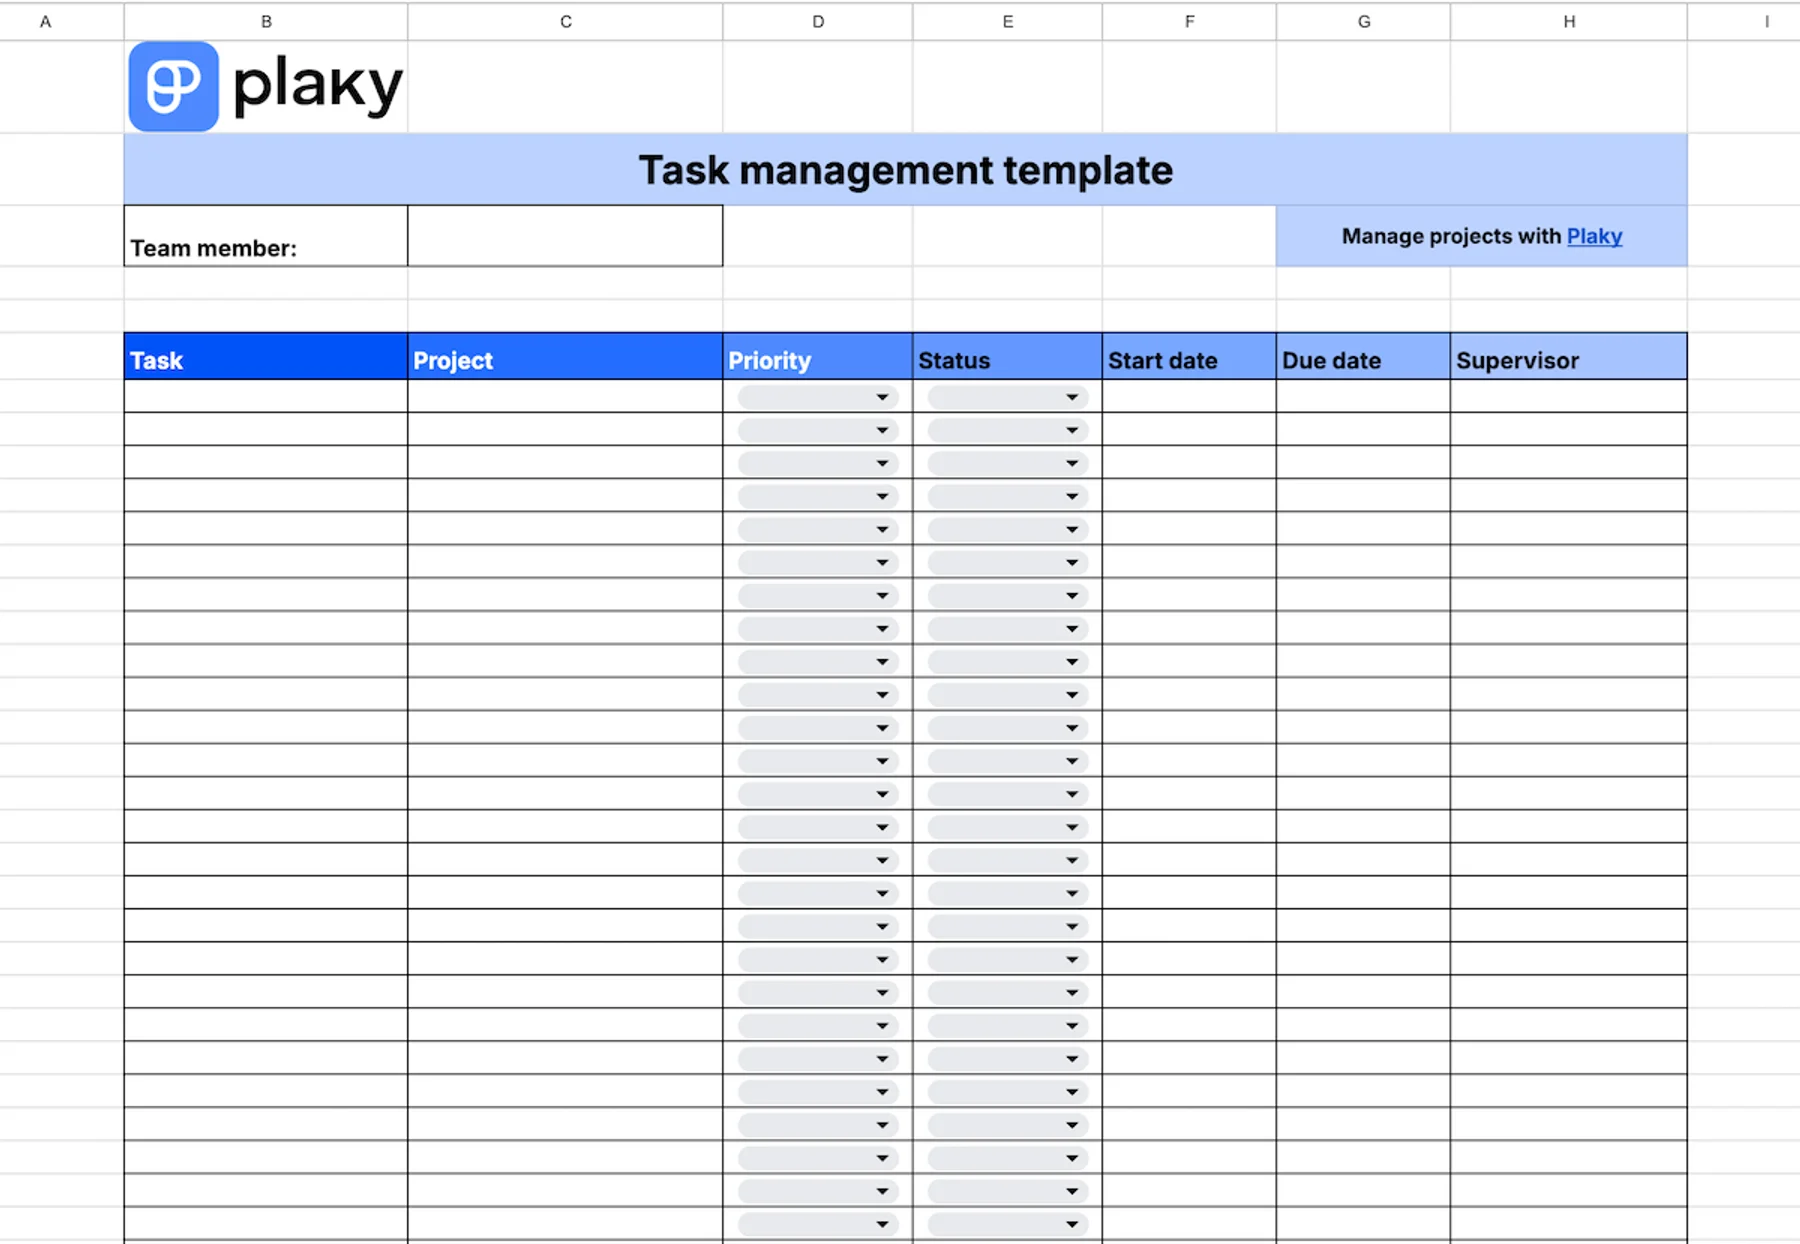
Get our Google Sheets task management template
This Google Sheets task management template is designed for team members who want to track all their tasks across any number of projects. It functions as a database for all your work, without other teammates’ tasks there to distract you.
Our Google Sheets task management template is best for people working on several projects at the same time or collaborating with different departments daily.
You’ll get to create a comprehensive list of your tasks, which should help you spot if some timelines are overlapping and adjust them. Plus, you’ll be able to prioritize tasks across different projects.

#15: Google Sheets project schedule template
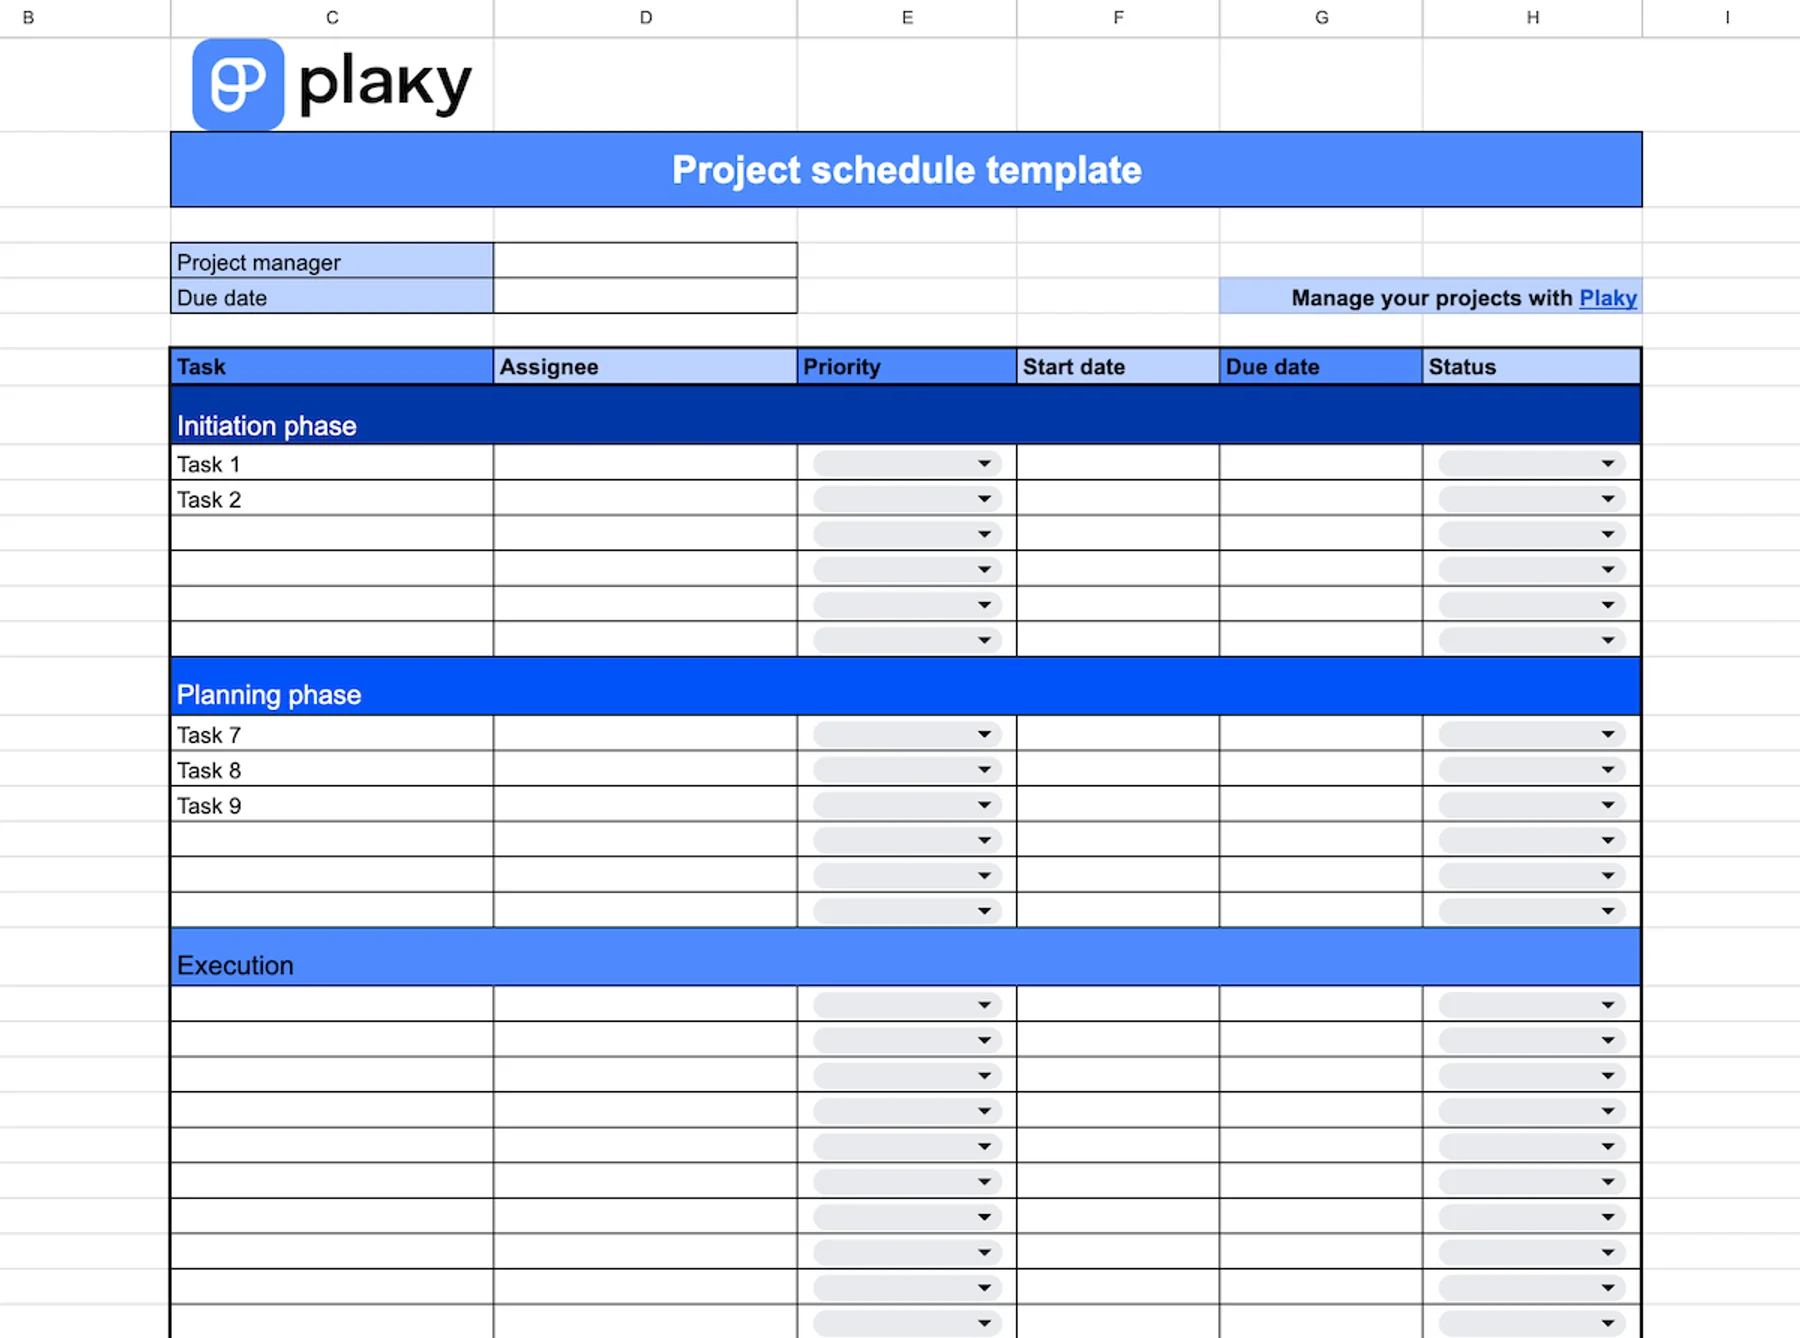
Get our Google Sheets project schedule template
This project schedule template classifies all your project tasks into 5 phases of project management:
- Initiation
- Planning
- Execution
- Monitoring and control
- Closure
This helps you know exactly what needs to be done, by whom, and when, for the project to move on to the next phase.
Our Google Sheets project schedule template is best for planning all steps of the project in detail from start to finish. This minimizes the chances of unexpected problems arising later.
#16: Google sheets project tracker template
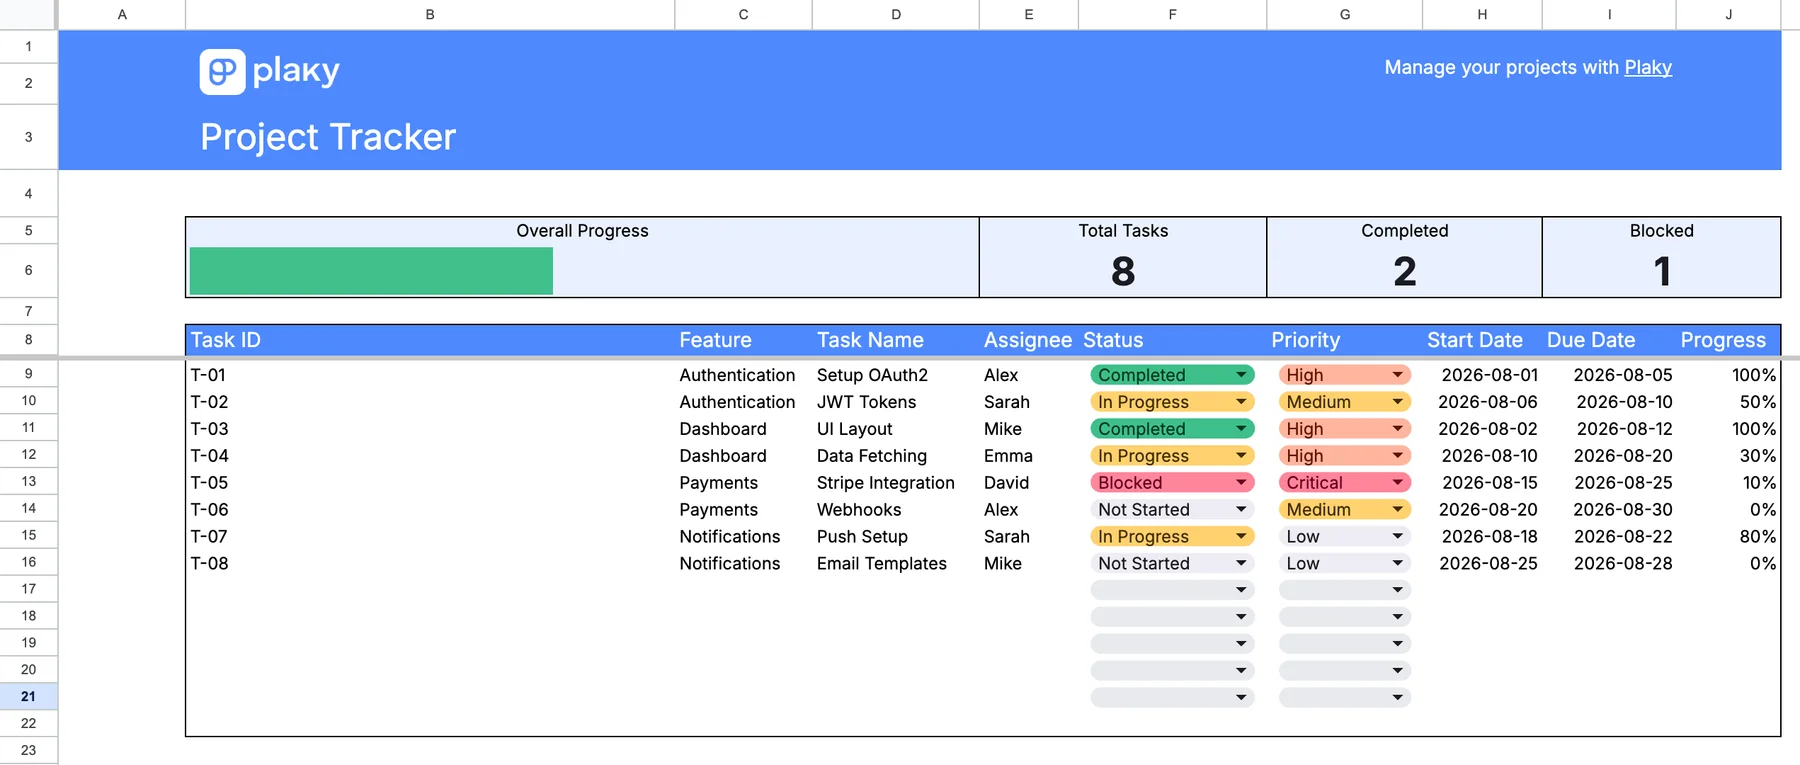
Get our Google Sheets project tracker template
Managing multiple projects can get complicated when deadlines, tasks, and responsibilities are scattered across different places.
This Google Sheets project tracker template gives you a simple way to:
- Organize project details.
- Assign tasks.
- Monitor progress.
- Keep important deadlines visible.
It has a progress bar for each task, and an overall task tally.
Use it to get a clear overview of what’s happening across your projects without building a tracker from scratch.
This Google Sheets template is best for managing projects, deadlines, tasks, and team responsibilities in one place.
#17: Google Sheets task tracker template
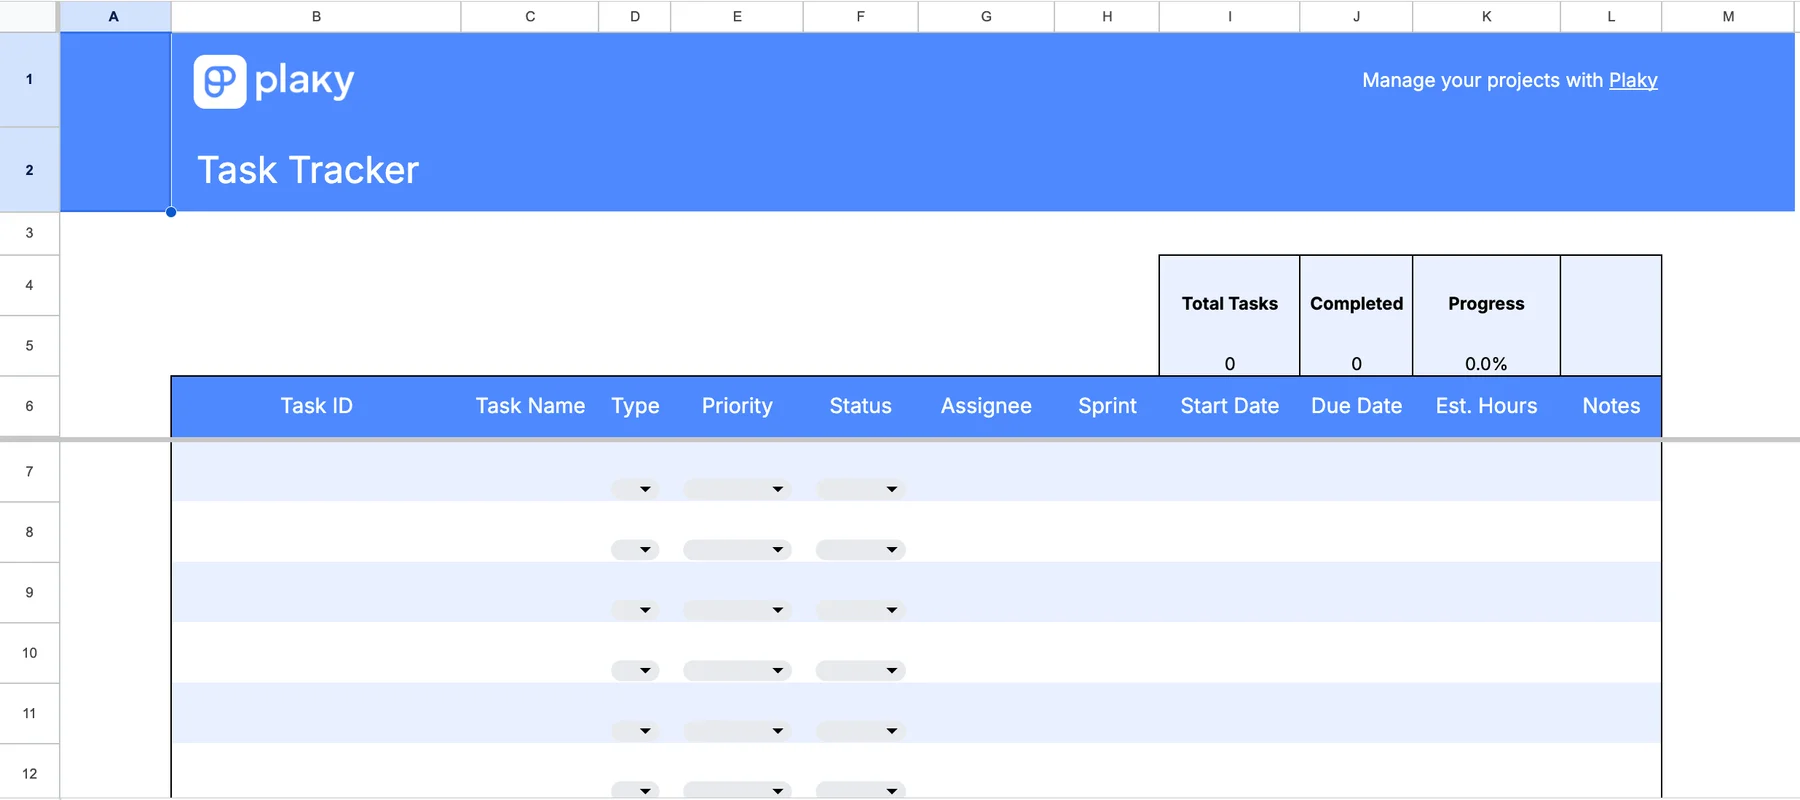
Get our Google Sheets task tracker template
Keeping track of every task is challenging when your to-do list keeps growing.
This task tracker template helps you:
- Organize tasks.
- Assign responsibilities.
- Set priorities.
- Monitor their status.
It has a total task counter and progress tracker, and you can enter the number of hours you estimate the task is going to take. You can also leave notes.
This task tracker template is best for organizing daily tasks, assigning responsibilities, and keeping track of progress for individual tasks.
#18: Google Sheets calendar template
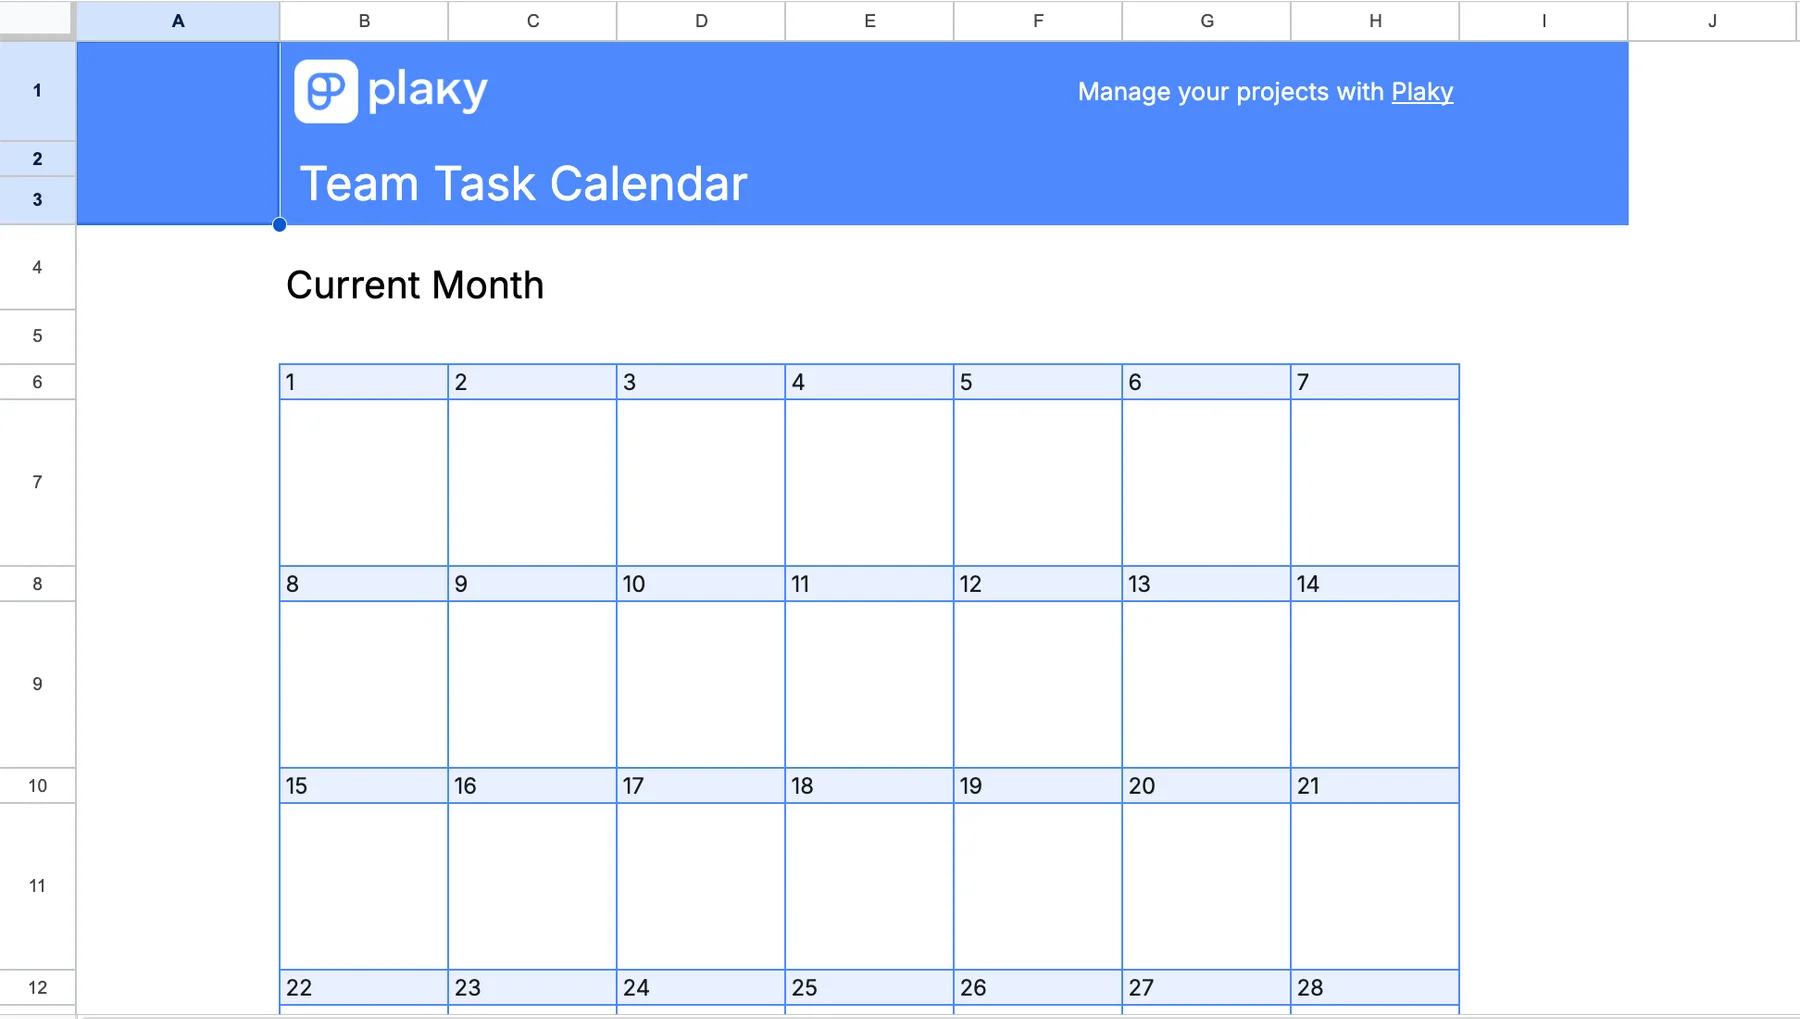
Get our Google Sheets calendar template
This Google Sheets calendar template helps you plan important dates, meetings, deadlines, and events in one convenient place.
It’s a simple calendar format, where you can enter important dates and deadlines.
Use it to map out your days, weeks, or months and keep upcoming commitments easy to find. Customize the calendar to fit your schedule and start planning without having to create one from scratch.
This Google Sheets calendar template is best for planning meetings, events, deadlines, and other important dates.
#19: Google Sheets budget template
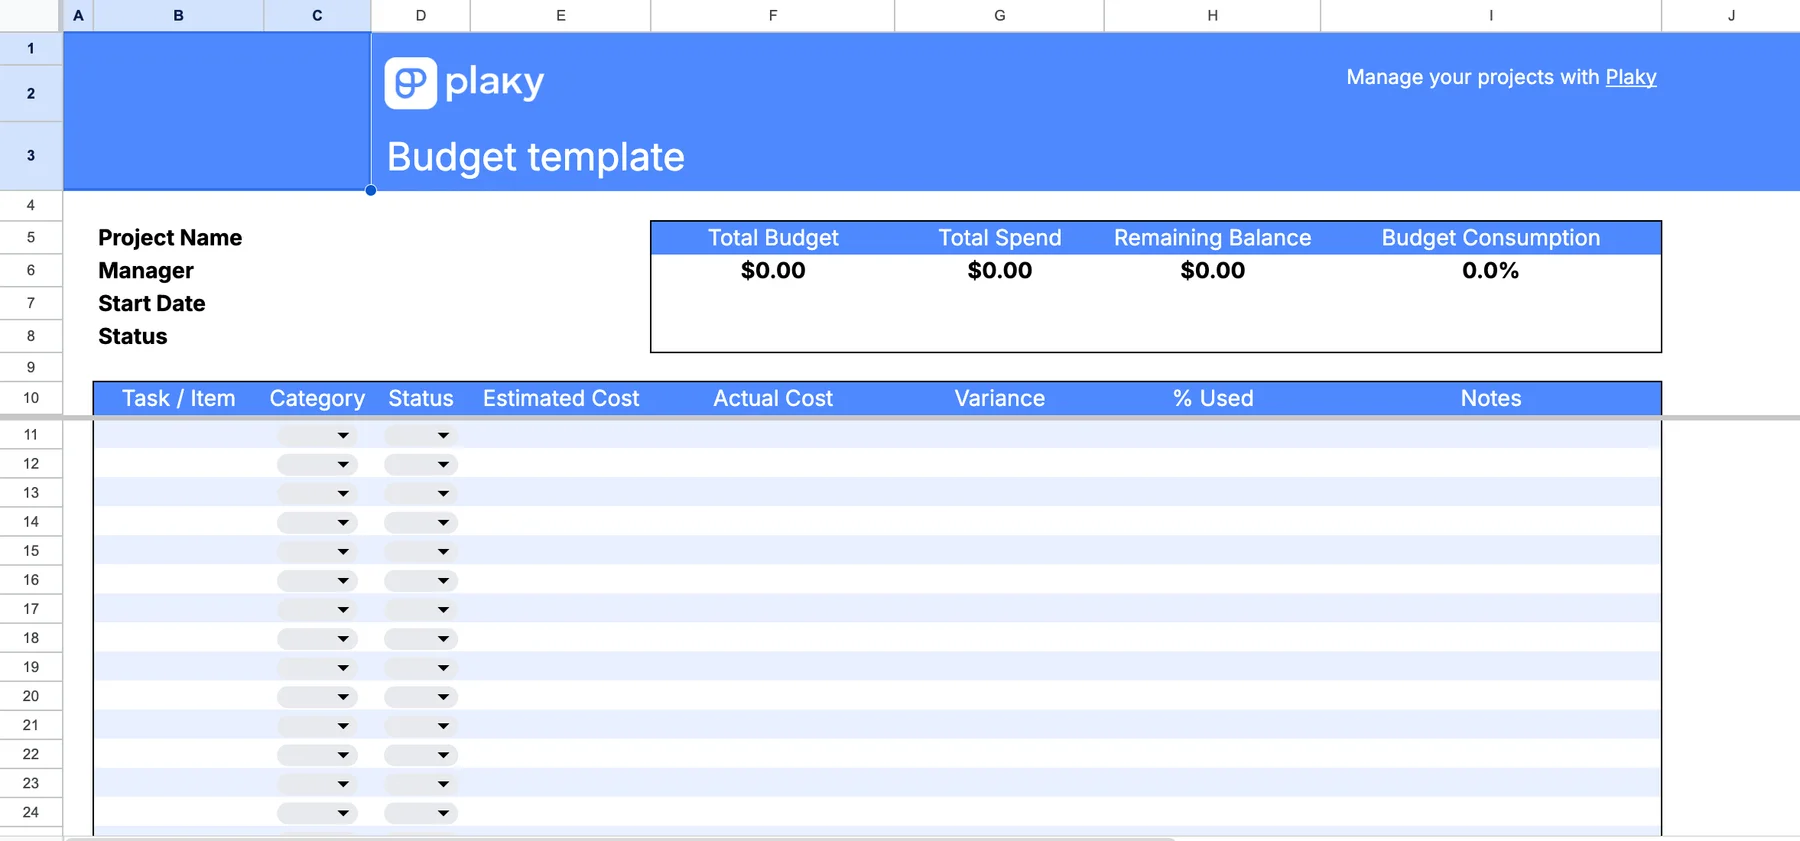
Get our Google Sheets budget template
Keeping your finances organized starts with knowing where your money goes.
This budget template helps you:
- Track income and expenses.
- See how much each task costs.
- Compare your planned budget with actual expenses.
Use it to get a clearer picture of your finances, identify where you may be overspending, and make more informed decisions about your money.
It’s best for tracking income and expenses, spending categories, and overall budget performance.
#20: Google Sheets KPI dashboard template
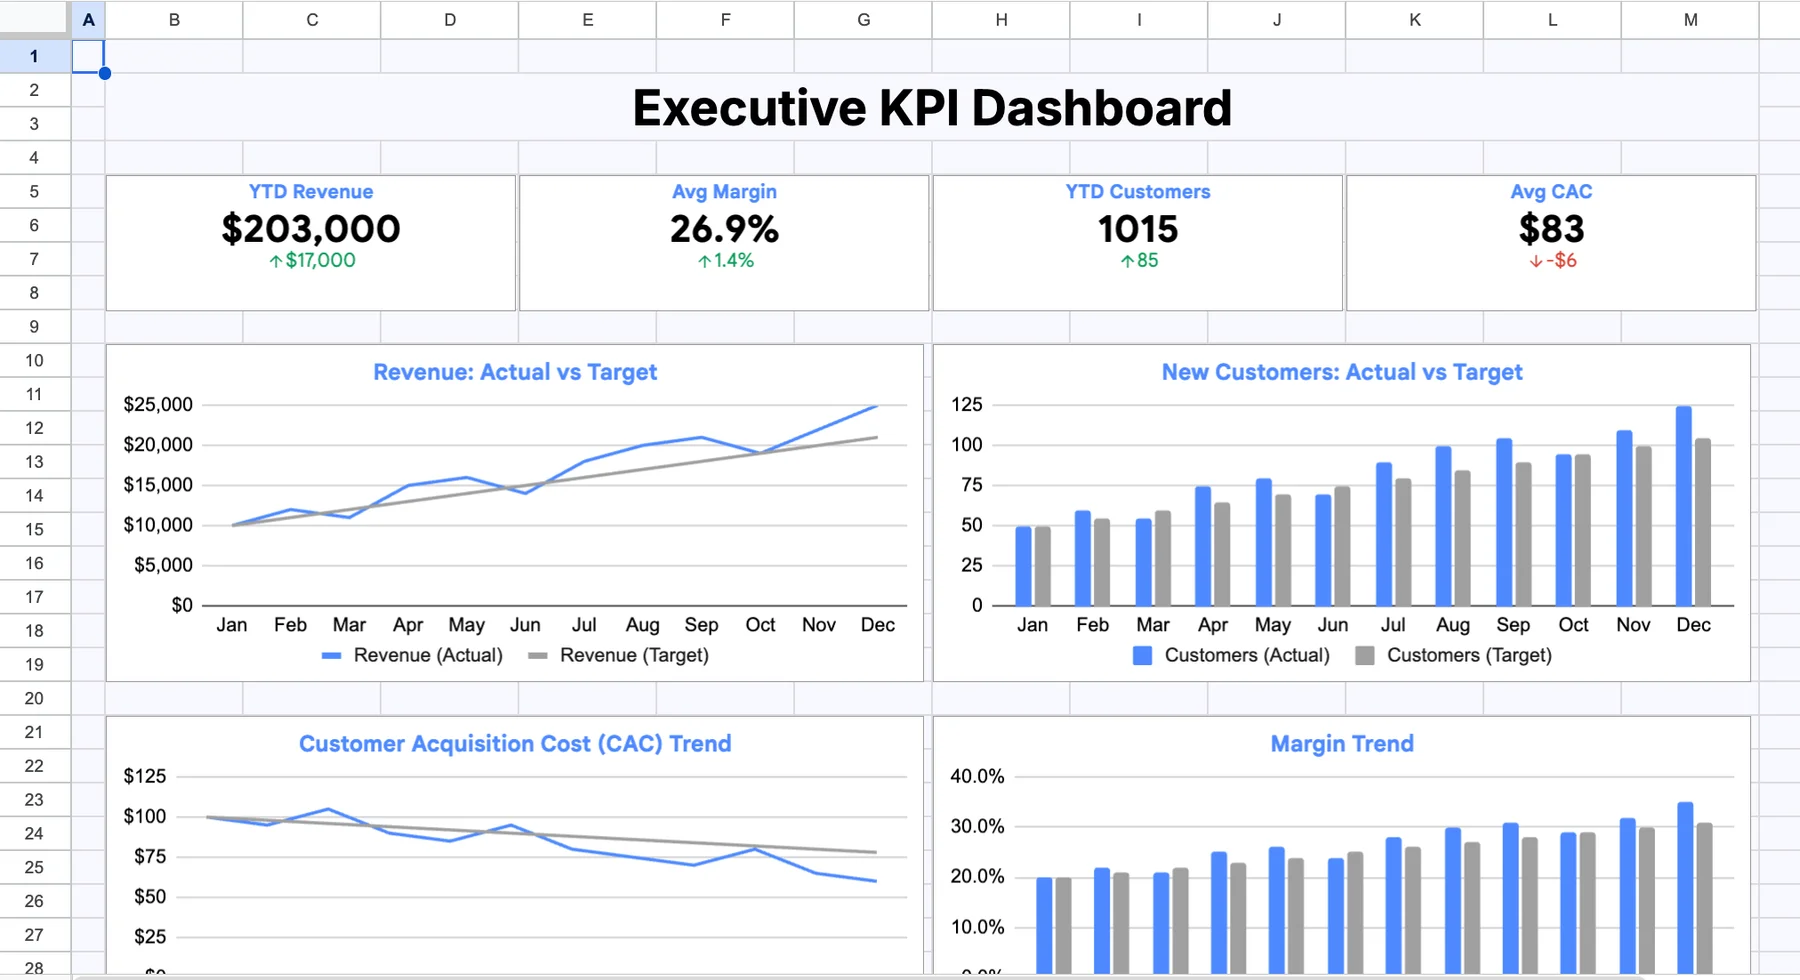
Get our Google Sheets KPI dashboard template
Tracking key performance indicators makes it easier to see whether you’re moving toward your goals.
This KPI tracker template helps you organize important metrics, record performance data, and monitor changes over time, all in one dashboard.
You simply enter your data in the Data tab, and Sheets will automatically update the dashboard view.
Use it to keep your team’s most important numbers in one place and quickly identify areas that are performing well or need attention.
A KPI tracker such as this one is best for monitoring key performance indicators and tracking progress towards overall goals.
How to create a dashboard for project management in Google Sheets
You can create a dashboard in Google Sheets using a simple task table, a few formulas, and 4 charts.
A project dashboard gives you a quick overview of:
- What your team is working on
- How tasks are progressing
- Where your workload is concentrated
Here’s how.
#1: Set up your task table
Start by creating a table where each row represents one task. Include columns for the information you want to visualize, such as:
- Task — the name of the task
- Assignee — the person responsible for it
- Priority — High, Mid, or Low
- Status — To do, Doing, or Done
- Project — the project the task belongs to
Keep your category names consistent throughout the table. For example, if you use “High” as a priority, don’t enter “High priority” for another task later.
#2: Create a summary for tasks per assignee
On a separate dashboard area, list each assignee and calculate how many tasks are assigned to them.
If the Assignee column is column B, you can count tasks for a specific person with:
`=COUNTIF($B$2:$B,A2)`
Here, `A2` contains the assignee’s name. Copy the formula down for every team member.
Select the resulting 2-column summary, and go to Insert → Chart. Choose a column chart to create the “Tasks per assignee” visualization.
#3: Create a task status chart
Create another 2-column summary containing each status and its task count. For example:
| Status | Tasks |
|---|---|
| To do | =COUNTIF($D$2:$D,”To do”) |
| Doing | =COUNTIF($D$2:$D,”Doing”) |
| Done | =COUNTIF($D$2:$D,”Done”) |
Select this range and insert a bar chart. The result gives you a quick comparison of how many tasks are still to do, currently being worked on, or completed.
#4: Create a task priority chart
For the priority breakdown, create a summary containing High, Mid, and Low, and count how many tasks fall into each category:
- `=COUNTIF($C$2:$C,”High”)`
- `=COUNTIF($C$2:$C,”Mid”)`
- `=COUNTIF($C$2:$C,”Low”)`
Select the summary, and insert a pie chart. Google Sheets will automatically convert the counts into percentages, giving you a visual representation of the distribution shown in the template.
#5: Create a tasks-per-project chart
Repeat the same process for projects. List each project, and count how many tasks belong to it. If the Project column is column E, a formula for a project listed in A2 would be:
`=COUNTIF($E$2:$E,A2)`
Select the project names and their counts, then choose Insert → Chart → Pie chart. This creates a visualization of how your team’s tasks are distributed between projects.
#6: Make your ranges dynamic
One of the easiest ways to prevent a dashboard from becoming outdated is to use open-ended ranges. Instead of:
`=COUNTIF($D$2:$D$30,”Done”)`
use:
`=COUNTIF($D$2:$D,”Done”)`
The second version continues down the column, so tasks added after row 30 are included automatically.
If you use fixed ranges for your charts or summary formulas, remember to expand them whenever you add rows. Otherwise, your dashboard can show lower totals than your actual task list.
#7: Arrange your dashboard
Create a separate sheet called Dashboard, and place your four charts there. A layout similar to the template works well:
- Top left: Tasks per assignee
- Top right: Task status
- Bottom left: Task priority
- Bottom right: Tasks per project
Add clear chart titles so someone can understand each visualization without looking at the underlying data.
Once everything is connected, updating the task table will update the summary counts and, in turn, the charts. You now have a project dashboard that shows workload, status, priorities, and project distribution in one place — without having to manually create a new report every time your data changes.
When a Google Sheets dashboard stops being worth it
Google Sheets can be a perfectly good project management dashboard tool when your data is relatively small, your reporting needs are simple, and you’re comfortable maintaining the formulas yourself. The problem starts when the dashboard becomes something your team depends on every day.
A Google Sheets dashboard can become fragile as your project or team grows. Formulas with fixed ranges may stop counting newly added rows, and pulling information from several sheets into one reliable overview can require increasingly complex formulas. You also have to manage how people access the dashboard yourself, and keeping the data current may involve manual refreshes or checks.
That’s usually the point where staying in Sheets stops being the best option. If you only need a lightweight overview for yourself or a small project, Sheets may still be the right call. But if you need a dashboard that brings project data together and stays current without constant spreadsheet maintenance, a dedicated project management dashboard can save you the work.
Upgrade to Plaky’s Dashboards
Plaky is a project management tool designed for that next step. Instead of building formulas to combine reporting data, you can connect boards from the same workspace and visualize them with bar and pie chart widgets.
The widgets automatically refresh every 15 minutes, so the dashboard can stay current without someone having to manually update it.
It’s also worth distinguishing the Chart view from Dashboards in Plaky:
- Chart view is a board-level view: it visualizes the data from an individual Board with pie and bar charts.
- Dashboards are Space-level, letting you bring data from multiple Boards into one overview.
Access can be controlled, too. Plaky lets you make Dashboards private and give access to selected members, while Board permissions determine who can view or edit project data.
Plaky’s limits are straightforward:
- The Free plan supports 1 Board per dashboard.
- Pro supports up to 15 Boards per dashboard.
- Enterprise supports up to 30 Boards per dashboard.
FAQ
Now, we’ll answer some frequently asked questions about Google Sheets and how to use them for project management.
Can I use Google Sheets for project management?
Yes, Google Sheets can work for project management when you need a simple, flexible way to organize tasks, deadlines, responsibilities, and project data. You can use tables, dropdowns, filters, formulas, and charts to create a basic project tracker or dashboard, although larger or more complex projects may require more manual setup and maintenance.
Can Google Sheets create a dashboard?
Yes, you can create a dashboard in Google Sheets by organizing your data in a table, summarizing it with formulas or pivot tables, and turning those summaries into charts. Google Sheets supports multiple chart types, including bar, column, pie, line, gauge, and table charts, which you can arrange together on a dashboard sheet.
How to create a dashboard for project management?
To create a project management dashboard in Google Sheets, first organize your project data into a table with fields such as task, assignee, status, priority, project, and due date. Then create summary tables or pivot tables, add charts based on those summaries, and arrange the charts on a separate dashboard tab.
How can I create a KPI dashboard in Google Sheets?
To create a KPI dashboard, define the metrics you want to track, add the underlying data to Sheets, and calculate each KPI with formulas or pivot tables. You can then use charts or other visual elements to display trends and comparisons, keeping the most important metrics together on one dashboard.
How do I build my own dashboard?
Start with a clean data table and decide which questions the dashboard needs to answer. Create summary tables for those metrics, select the appropriate charts in Insert → Chart, adjust their data ranges and appearance, and arrange them together on a dedicated dashboard sheet.
Does Google have a free project management tool?
Google doesn’t offer a dedicated, full-featured project management platform comparable to specialized project management software, but it does provide tools that can support project work. Google Tasks handles to-dos, due dates, subtasks, reminders, and task lists, while Sheets can be used to build project trackers and dashboards.
Does Google have a dashboard tool?
Google Sheets can be used to build dashboards from spreadsheet data, including dashboards made with charts, pivot tables, and other visualizations. Google also offers Sheets Canvas, which can create interactive dashboards and other visual layouts with Gemini for eligible plans, although Canvas uses data from a single Sheet tab.
What does a good dashboard look like?
A good dashboard puts the most important information in one place and makes it easy to understand at a glance. It should focus on relevant metrics, use charts that match the data, avoid unnecessary visual clutter, and make trends, comparisons, or problems immediately apparent.
What are the 4 types of dashboards?
The 4 commonly cited types are:
- Estratégica
- Analytical
- Operational
- Tactical
Strategic dashboards focus on high-level goals and long-term performance, analytical dashboards support deeper analysis, operational dashboards monitor day-to-day activity, and tactical dashboards help teams track progress toward shorter-term objectives.
Google Sheets are outdated — try Plaky by CAKE.com
Google Sheets are good for basic project management, but they can quickly become frustrating. If you want to automatize your workflow, there are so many formulas to get through that it’s sometimes easier to just enter information manually.
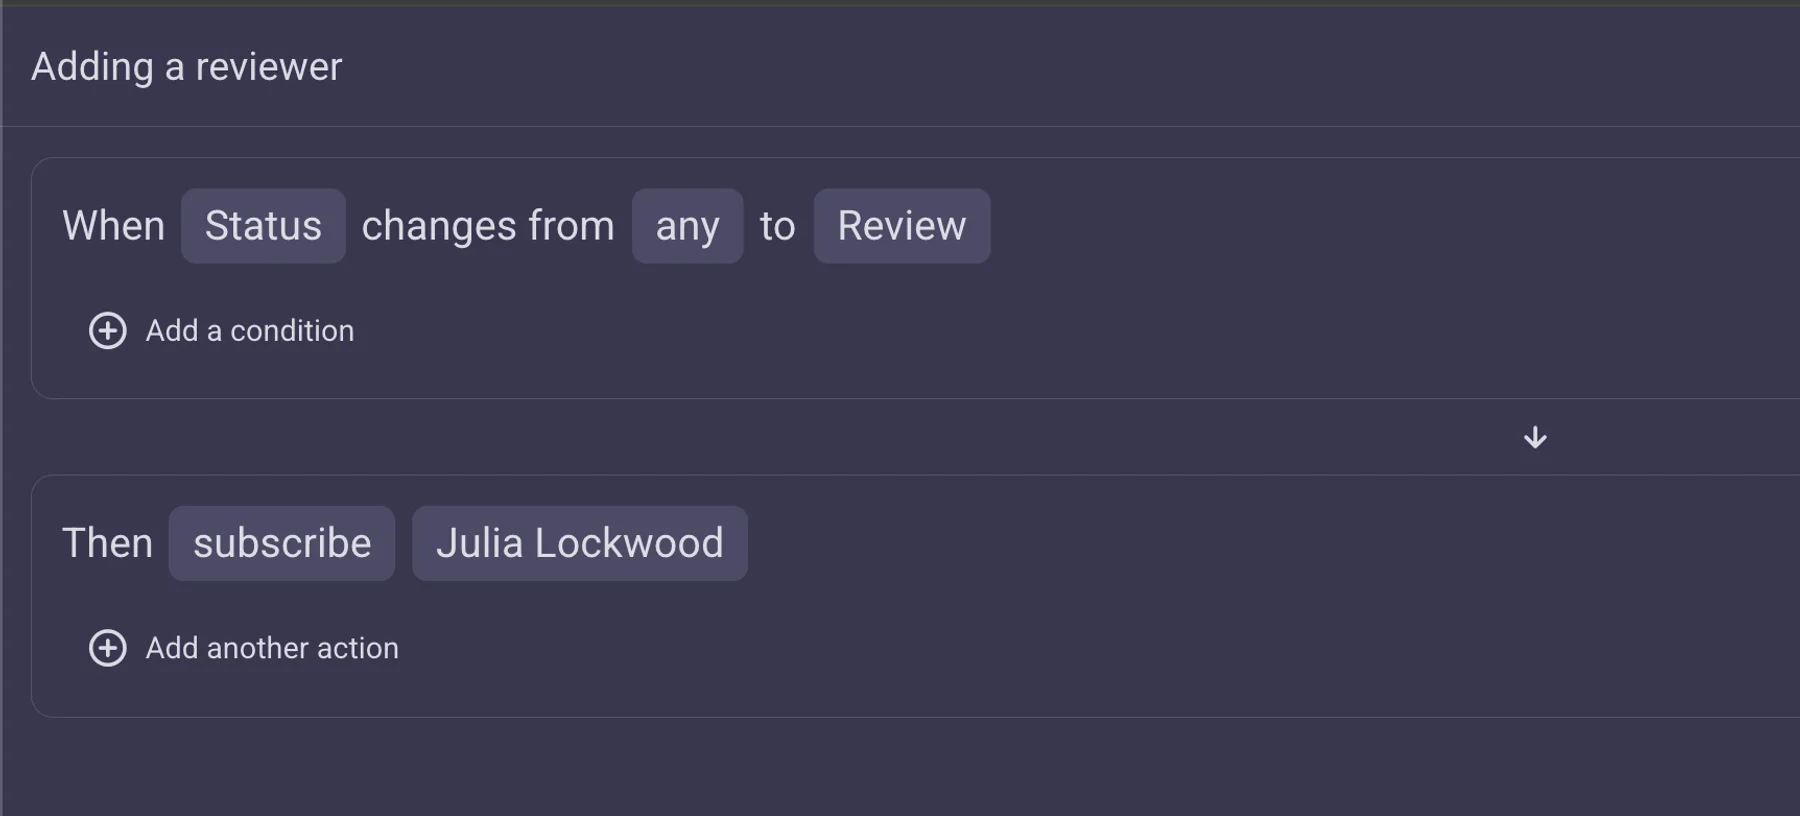
In Plaky, you can automate all those boring and repetitive tasks and focus on actual valuable work. For example, you can set up your board automations so that:
- When a task status is changed to ‘Review’, a reviewer is subscribed to the task.
- When a task status is changed to Stuck’ and the priority is ‘High’, the project manager is subscribed.
- When a deadline is added to an item, the status changes from ‘On hold’ to ‘To do’.
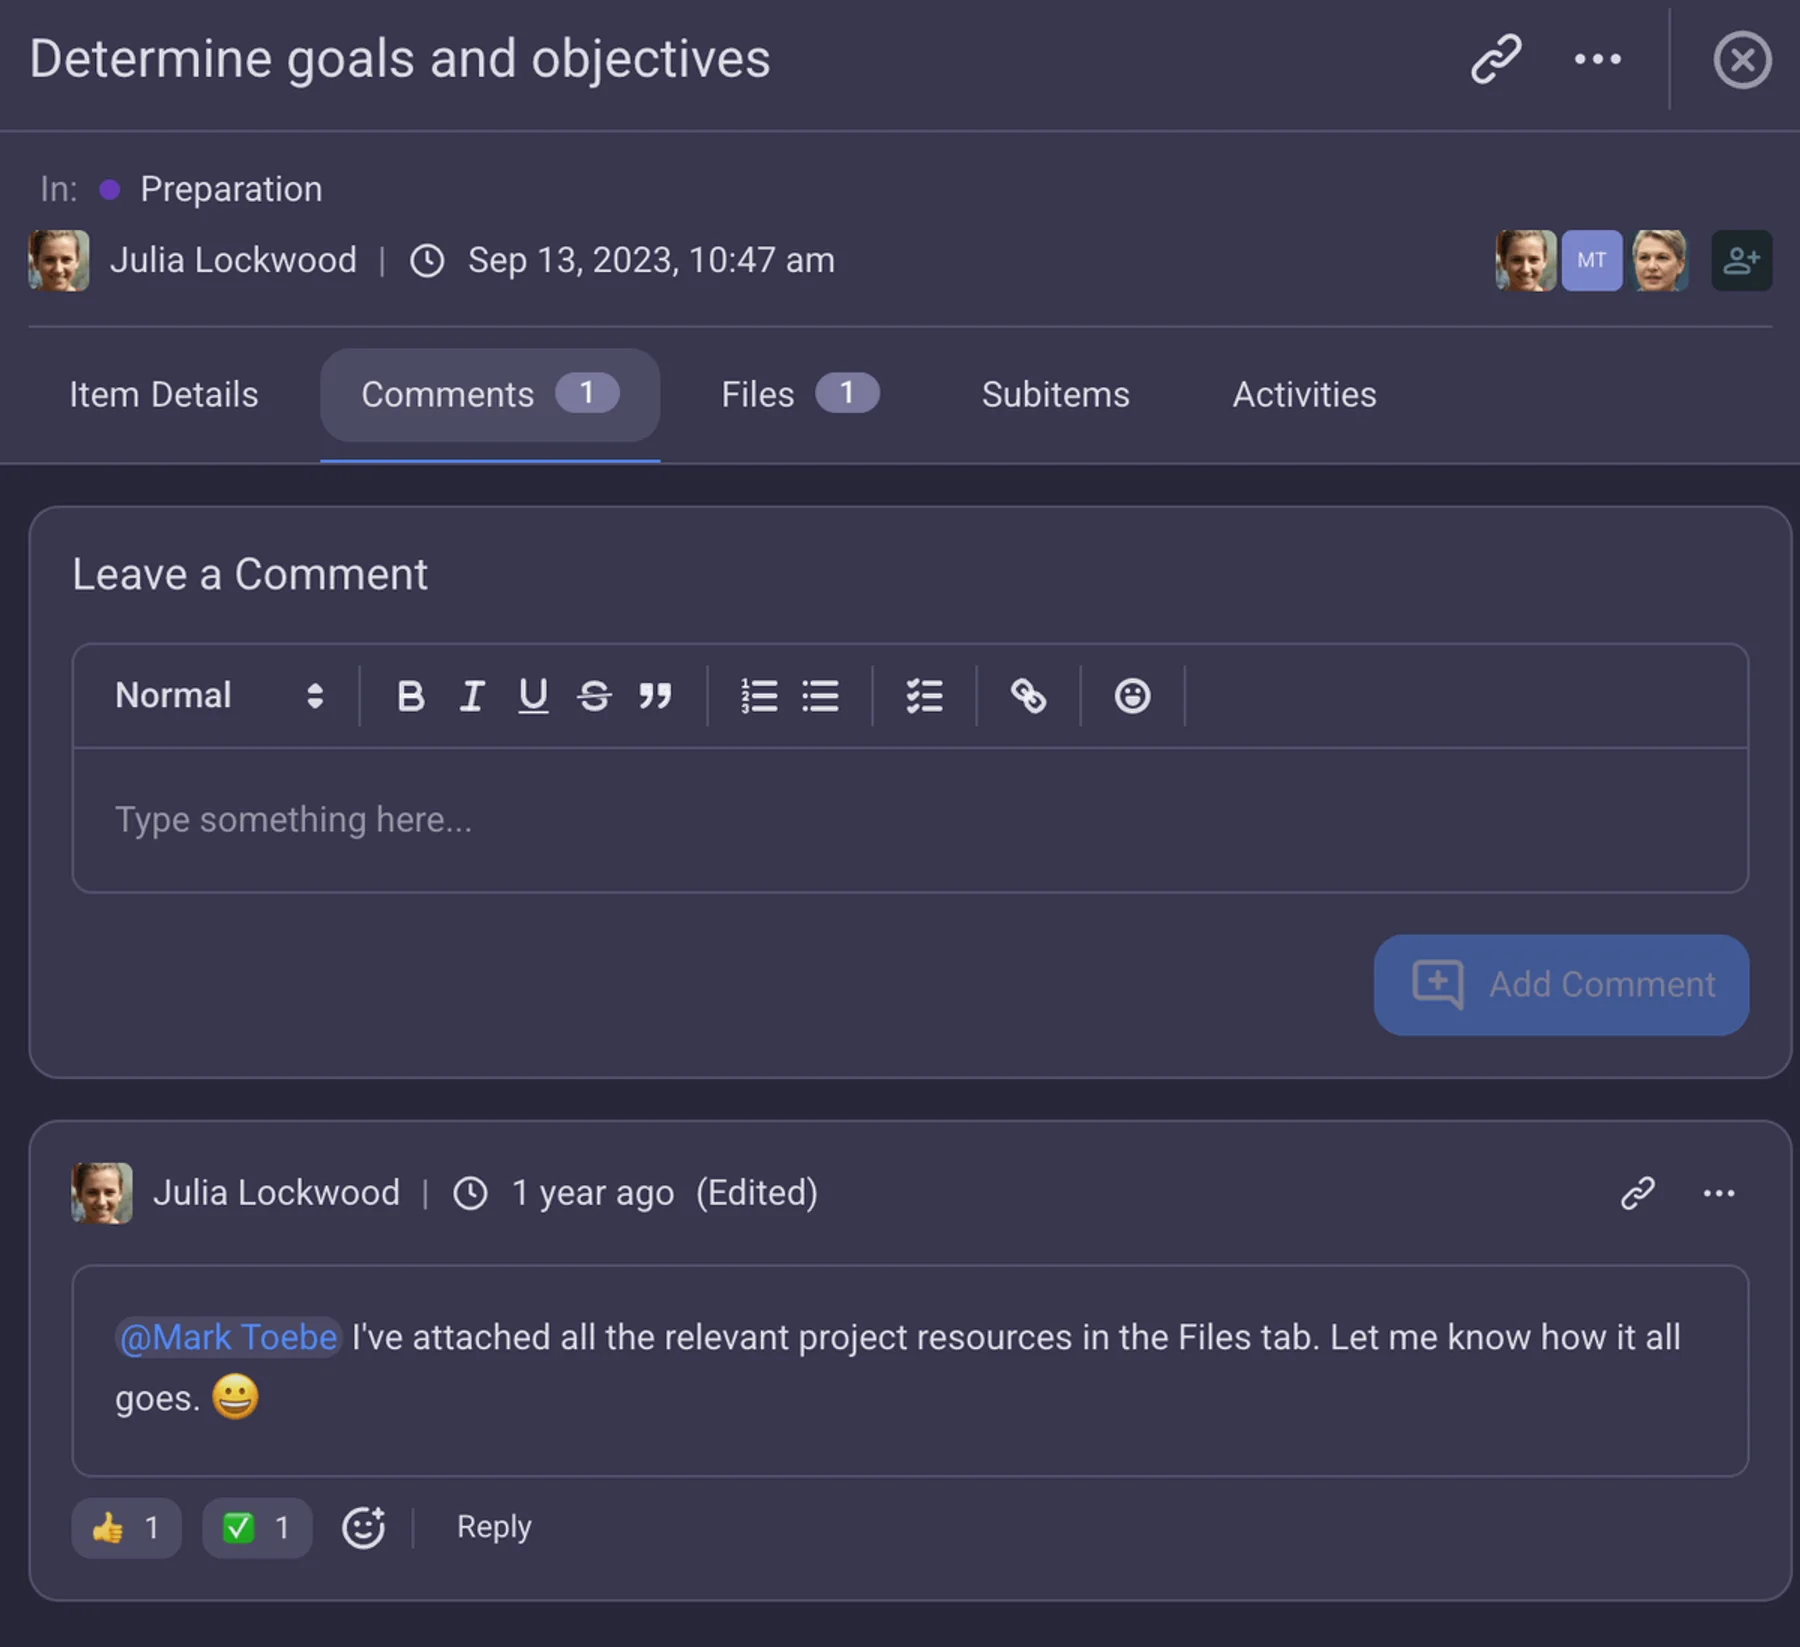
Plus, you can communicate smoothly with your team members through task comments.
Although Google Sheets has comments in files, they are still quite rudimentary. In Plaky, on the other hand, you have a designated space for communication in each task, where you can leave feedback or ask questions.
Plaky by CAKE.com also offers a rich library of colorful and easy-to-use templates that you can adapt to your projects instead of relying on Google Sheets. All templates are completely customizable, so you can tailor them seamlessly to your workflows.
Plus, each project board in Plaky can be viewed as a:
- Table — for a comprehensive look at all task details represented by various Plaky custom fields
- Kanban board — for effortless progress tracking as you drag and drop tasks from the ‘to do’ to the ‘done’ column
- Gantt chart — for keeping an eye on the project timeline and spotting bottlenecks
- Pie or bar chart — for visual representation of the most important information, such as task status or priority, and easy data analysis
On top of that, Plaky has recently rolled out Dashboards that pull data from your boards and consolidate it into one place. With Dashboards, it’s easy to visualize and track progress across all your projects in pie or bar chart widgets.
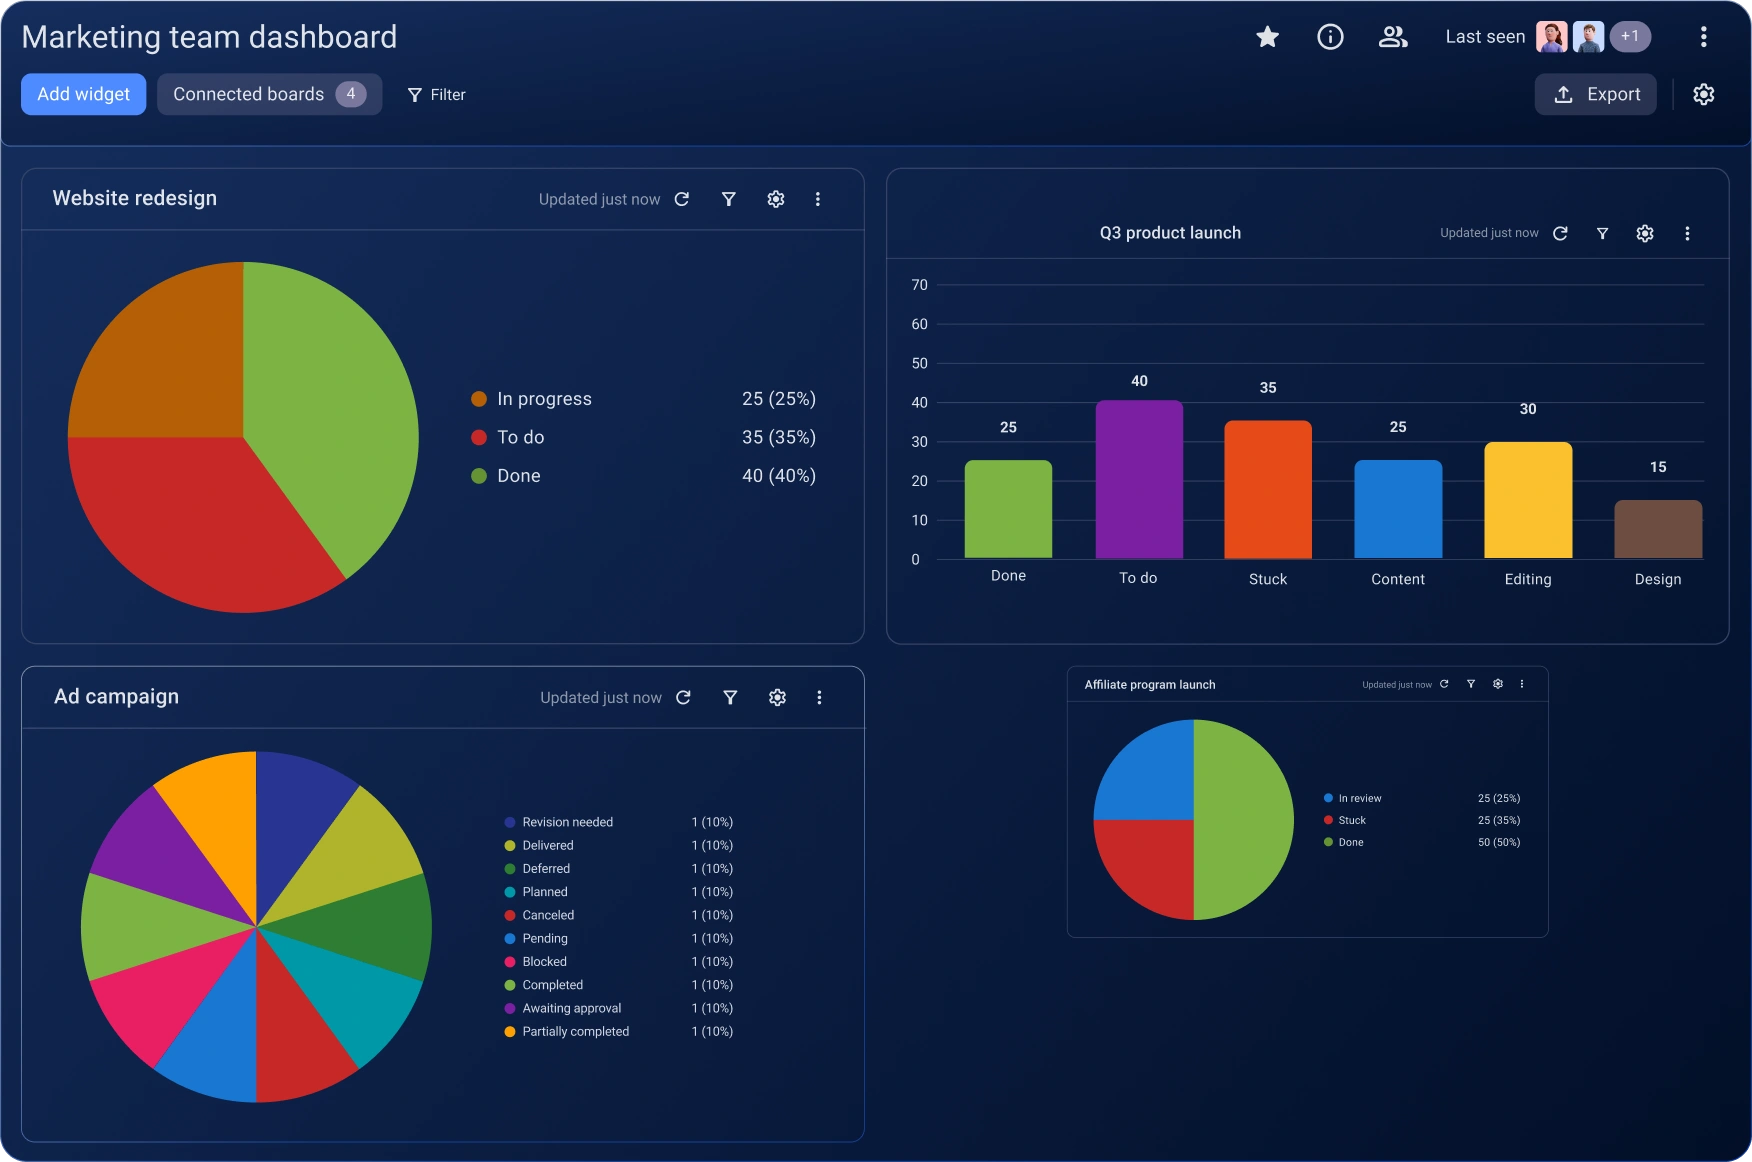
Plaky Dashboards are also easy to share — you can export them in various formats.
Create detailed and automated templates for your projects. Sign up for a free Plaky account today!
Comece a usar o Plaky da CAKE.com
Como revisamos esta publicação: Nossos redatores e editores monitoram as publicações e as atualizam quando novas informações são disponibilizadas, para mantê-las atualizadas e relevantes.