 Updated: outubro 2, 2023
 Starting work on a project without knowing all the steps and time limitations beforehand is a recipe for disaster.
Fortunately, we have a great tool to help you organize your projects and track their progress — a project timeline.
In this guide, you will learn:
- What a project timeline is,
- Which types of timelines you have at your disposal,
- What the benefits of having a project timeline are, and
- How to create a project timeline using project management software.
We will also provide you with a project timeline example to illustrate the matter, as well as free project timeline templates you can use.
So, without further ado, let’s dive into the world of project timelines!
- A project timeline is a visual overview of an entire project, from start to finish, that represents tasks and activities in chronological order.
- The first step to creating a timeline is to decide who your intended audience is.
- A project timeline includes all the upcoming tasks and identifies task dependencies.
- When creating a project timeline you must also identify project scope, use WBS, set milestones, and plan your resources.
- The easiest way to create a project timeline is to use a template or a project management tool.
- A high-quality project timeline keeps everyone in the loop and makes the project processes transparent.
What is a project timeline?
A project timeline is a visual overview of an entire project, from start to finish, that represents tasks and activities in chronological order.
A project timeline incorporates the following elements:
- Tarefas do projeto
- Task due dates,
- Duração das tarefas
- Task dependencies, and
- Milestones.
According to the latest project management statistics, only 59% of projects get completed on time, even when a formal project management methodology is used.
Having a project timeline helps keep your team on track and prevents your project from stalling.
With the help of a project timeline, project stakeholders and team members can get a quick overview of a project at a glance.
How to create a project timeline in 9 steps
Creating a project timeline can be a complex endeavor that requires 9 steps.
The end result will definitely be worth the effort, though.
To create a project timeline, you should:
- Think about the intended audience,
- Identify project scope,
- Use a work breakdown structure (WBS),
- Create tasks,
- Determine dependencies,
- Set milestones,
- Estimate the time required for each task,
- Determine the availability of your resources, and
- Use a project timeline template or project management software.
Now, let’s discuss each step in more detail.
#1 Think about the intended audience
Before you begin working out the small details of your project timeline, you must decide who the intended audience is.
We had an opportunity to discuss project timelines with Dimitri Graf, a PMP- and PgMP-certified professional, who explained why it’s essential to take into account who will be reading the project timeline:

“Think about the audience, the recipients. You will likely need more than one version of a project timeline with varying levels of granularity and focus.
For example, your high-level stakeholders (such as a project sponsor) care about major milestones — when does the project start, what are the phases, when does a regulator enter the picture, when is the closure, and how long do the post-closure responsibilities last.
Your team, however, will need more than just a bird-eye view timeline. Therefore, you need to dig deeper and create a more detailed project schedule for the team.”
#2 Identify project scope
Project scope identifies all aspects of the work we need to deal with to develop a product or service.
Project scope is defined in the scope statement, which should be clear and precise, and include the following:
- Justification — why is there a need for the project?
- Goals — what does the project aim to achieve?
- Deliverables — what will the client receive after the project’s completion?
- Limitations — what rules and guidelines must team members follow while the project progresses, including deadlines and budget constraints?
- Exceptions — what will not be included in the project?
- Agreement — the signatures of all key stakeholders as proof that the document has been reviewed, comprehended, and approved.
💡 Dica profissional do Plaky
If you are curious about the project scope, read more about it in our comprehensive guide:
#3 Use a work breakdown structure (WBS) to break your project down into smaller chunks
A work breakdown structure (WBS) is an element of the scope baseline created in the project planning phase. It breaks down all the project work into smaller chunks.
These smaller chunks are not yet tasks — they are just smaller deliverables. You will later use them to set your project tasks and their dependencies.
An Assistant Professor of Project Management at Western Carolina University, Cullowhee, NC, and a holder of PMP and CSM certifications, Dr. Michael J. Shick, considers a WBS to be crucial for creating a project timeline:

“When creating a project timeline, it is essential to create a work breakdown structure (WBS), which is a hierarchical decomposition of all the work to be performed in the project. This enables project leaders and team members to develop a comprehensive task list of all activities and work packages. The project manager may establish the interdependencies, duration, and resources.”
A WBS makes a complex project seem significantly less intimidating, as it breaks the project into smaller parts, which can be easily managed and performed by smaller teams.
💡 Dica profissional do Plaky
Learn more about the WBS in our guide:
#4 Create tasks
Now that you’ve split your project into deliverables using the WBS, you should determine which steps you need to take to accomplish said deliverables. These steps will be your tasks.
For example, say you’re organizing a company’s annual retreat, and one of the deliverables is to choose a hotel. The tasks you should perform to complete this deliverable include:
- Deciding on the budget for the hotel,
- Making a list of hotels that have enough rooms for the entire company,
- Contact the hotels to check availability and if they can accommodate your needs, and
- Choose the hotel that best suits your needs.
#5 Determine dependencies
The next step is dedicated to determining dependencies between tasks.
In a nutshell, dependencies are relationships between tasks that dictate their order.
Existem 4 tipos de dependências de tarefas:
- Finish to Start (FS) — to start task B, you must finish task A first. For example, you cannot begin to create tasks in task management software if you haven’t signed up for an account.
- Finish to Finish (FF) — you cannot finish task B until you finish task A. For example, you cannot publish a book until the designers have finished the design for the cover. You can prepare the text and arrange everything, but you must wait for the designers to finish to actually publish the book.
- Start to Start (SS) — you cannot start Task B before starting Task A. For example, you cannot start cooking soup, until at least some of the ingredients have been prepared.
- Start to Finish (SF) — you must start task A before you can finish task B. A simple example of this is work in shifts. One worker cannot finish their job and leave their station until the next shift arrives and starts working.
To determine dependencies, you need to identify the following:
- Are there tasks that need to be completed for other tasks to start?
- Are there tasks that you must start or finish simultaneously?
- Do you need to start working on some tasks before completing other tasks?
For this purpose, you can create a dependency diagram to visualize the data by using a Gantt chart.
💡 Dica profissional do Plaky
Find out more about dependencies in our guide:
#6 Set milestones
A project milestone in project management marks significant events within a project and serves as a benchmark for the progress we’re making with our project.
An example of a milestone in project management could be any of the following:
- The start and end dates for project phases,
- Key deliverables,
- Securing the funds,
- Significant meetings,
- Stakeholder approvals that allow you to move to the next phase, or
- Customer approval.
#7 Estimate the time required for each task
If you want to achieve the previously mentioned milestones, you need to pay attention to project time management.
You should decide on how much time team members will spend on each task within a project. Try to be as realistic as you can.
When setting project deadlines, add buffer time to secure finishing your project on schedule, even if something unexpected occurs.
The more realistic you are, the better your team’s chances of achieving the milestones.
When estimating time, it’s also crucial to take into account the people who will be working on these tasks.
Don’t set dates that only look great to your stakeholders, while your team members struggle to achieve them and need to work overtime.
When we asked Tres Roeder, PMP, PMI-ACP certified author of A Sixth Sense for Project Management and Managing Project Stakeholders, how to create a high-quality project timeline, he pointed out that you should account for the time people need to adapt:

“A timeline should include an allocation of time for people to get comfortable with the changes. Most who create timelines understand that it is important to create the “critical path” of elements that are dependent on each other. Very few, however, put people into that formula. People need time to understand, process, and react to the project.”
💡 Dica profissional do Plaky
If you want to learn more about the critical path method, read our article on the topic:
#8 Determine the availability of your resources
You have already set deliverables, tasks, milestones, and deadlines.
Now, you have to think about the allocation of resources required to carry out the project.
Take into account your team members’ strengths, talents, and skills to pick the best person for each task.
For instance, if the task is to design a cover for a cookboo , and one of the illustrators has more interest and experience in cooking than others, they can create the main design, while the other team members can design smaller elements.
Last but not least — don’t forget to check whether your project schedule overlaps with the team member’s workload and schedule on other projects.
#9 Visualize your project timeline
There are 2 ways to visualize your project timeline:
- Use a project timeline template, or
- Use project management software.
Use a project timeline template to visualize your project timeline
If you want to see your tasks, milestones, and dependencies at a glance, but don’t have time to build templates from scratch, don’t worry — here are 11 different versions of project timeline templates for you..
So you can choose the one you prefer and start setting your own project timeline.
Use project management software to visualize your project timeline
Using templates is an excellent way to save time.
However, project management software provides way more options and is a lot more flexible than templates.
As Dr. Shick points out, using project management software offers many advantages:
“A high-quality timeline would include all the necessary information […] Ideally, that information should be loaded into project management software, so the project timeline can be created, updated, and managed as required. Further, the software allows for efficient updates when changes occur to the duration of activities or based on stakeholder involvement.”
Dr. Shick also shares how PM software can help with visualization:
“Additionally, software assists project managers with producing a visual depiction of the project timeline, whether it be more of a strategic chart such as a Gantt or a more tactical level visual representation in a Project Schedule Network Diagram, which has more granular level information for project teams.”
We will go into more detail a little later about how you can utilize Plaky, a project management tool, to create a timeline for your project.
Types of project timelines
There are various types of project timelines you can create depending on the type of project you are working on.
In this guide, we will focus on the following types of timelines in project management:
- Gantt chart timelines,
- Simple project timelines in Excel,
- Chronological chart timelines (vertical and horizontal), and
- PERT chart timelines.
We’ll briefly explain each type and provide you with an example.
#1 Gantt chart timeline
The Gantt chart is a widely used tool for creating project timelines. It is named after Henry Gantt, a well-known figure in project management history who popularized it as a project management tool around 1910.
However, Karol Adamiecki, a Polish engineer, management researcher, economist, and professor, invented the harmonogram in 1896 — which can be considered a predecessor of the Gantt chart.
The Gantt chart comes in handy for visualizing your project as it:
- Allows you to monitor the project schedule,
- Shows tasks and their dependencies, and
- Makes it possible to see at a glance how your project progresses.
You can create a Gantt chart for the whole project that will encompass an entire year for example, or several months. But, you can also make hourly or weekly Gantt charts for smaller chunks of a project.
We provide you with 2 examples of Gantt charts based on the timespan they encompass:
- Hourly Gantt chart and
- Weekly Gantt chart.
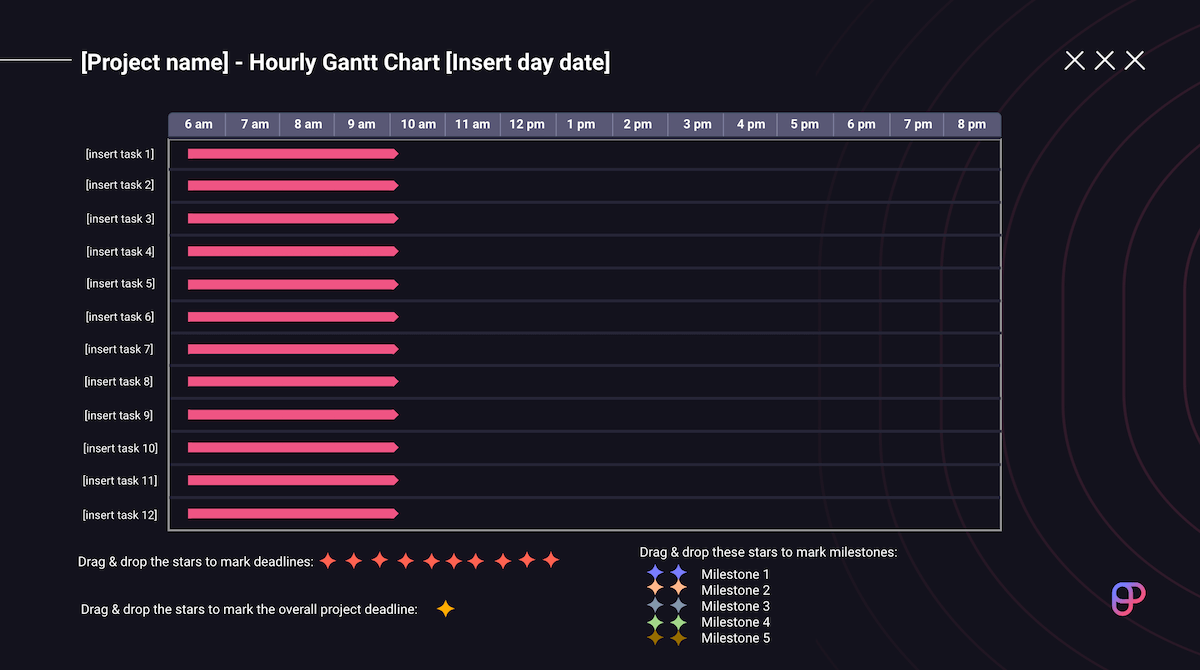
The timeline in each example consists of red arrows representing tasks and different stars representing milestones and deadlines.
Hourly Gantt chart
The hourly Gantt chart uses hours as a base unit and is great for more granular planning, such as organizing your daily work.
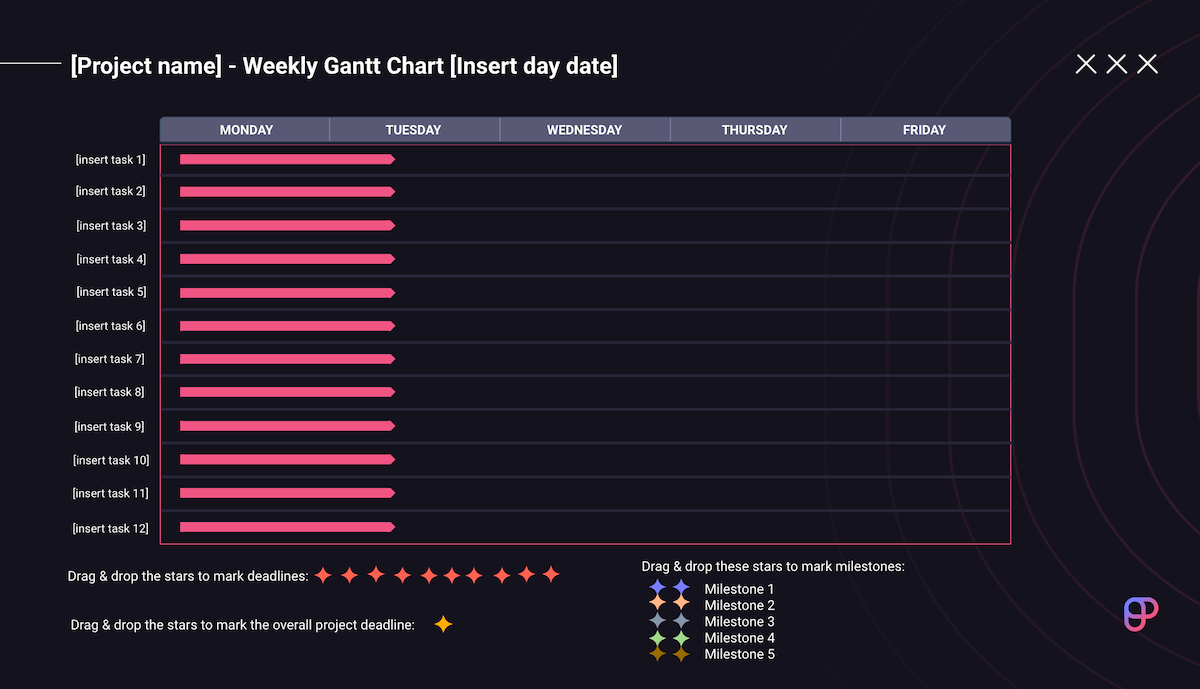
Weekly Gantt chart
In a weekly Gantt chart, each working day in a week represents one unit.
This type of chart is useful when you want to visualize part of your project, for example, all the tasks needed to accomplish one deliverable.
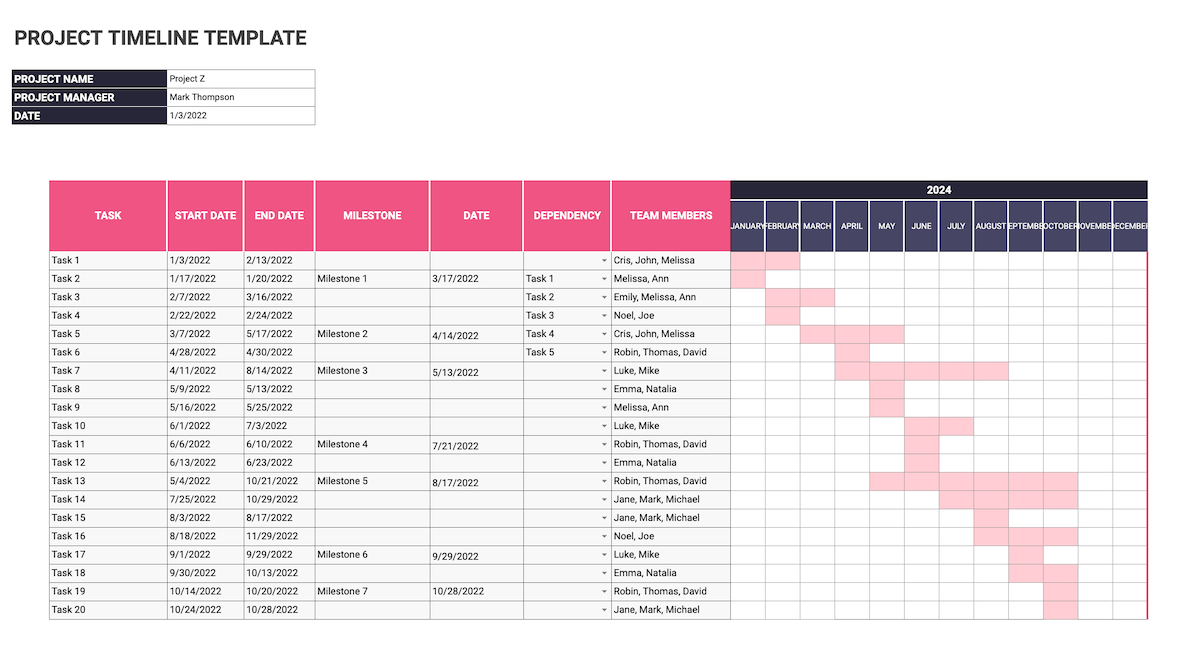
#2 Simple project timeline
Sometimes, you don’t need an overly elaborate timeline. For simple projects, a well-organized table in Google Sheets or Excel can do the trick.
We have provided you with 2 examples of a Google Sheets project timeline.
The first version of the Google Sheets project timeline contains a Gantt chart-like table with:
- Tarefas
- Start/end dates,
- Marcos
- Dependencies, and
- Team members.
The duration of each of the tasks from start to finish is marked on the timeline by coloring the cells in the table corresponding to the appropriate dates.
This project timeline is useful for projects in which tasks don’t have too many dependencies, and you need a clear overview of the start and end dates of each task.
💡 Dica profissional do Plaky
You can make your own Gantt chart in Google Sheets using one of the three methods presented in the blog post below:
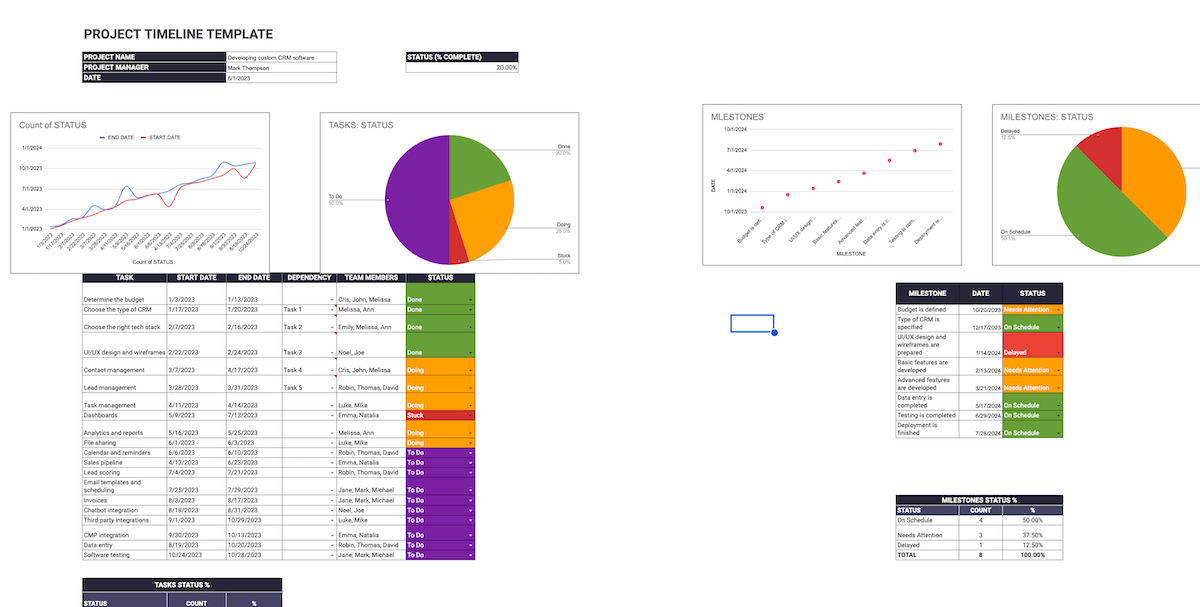
In the second version, the timeline consists of 2 tables:
- A task table with start/end dates, dependencies, team members, and statuses, and
- A milestone table with dates and statuses.
The information from both tables is also presented in the form of charts, to make it more clear.
The start and end dates of tasks and milestones are organized in a line chart, while a pie chart presents the status of each task and milestone in vivid colors.
This is a useful timeline for projects where you have to constantly keep track of the progress, and check the status of the tasks and milestones.
#3 Chronological chart timeline
As its name suggests, a chronological chart timeline shows tasks in chronological order and comes in 2 variations:
- A vertical chart timeline, and
- A horizontal chart timeline.
Depending on the selected timeline, we can display tasks from left to right or top to bottom.
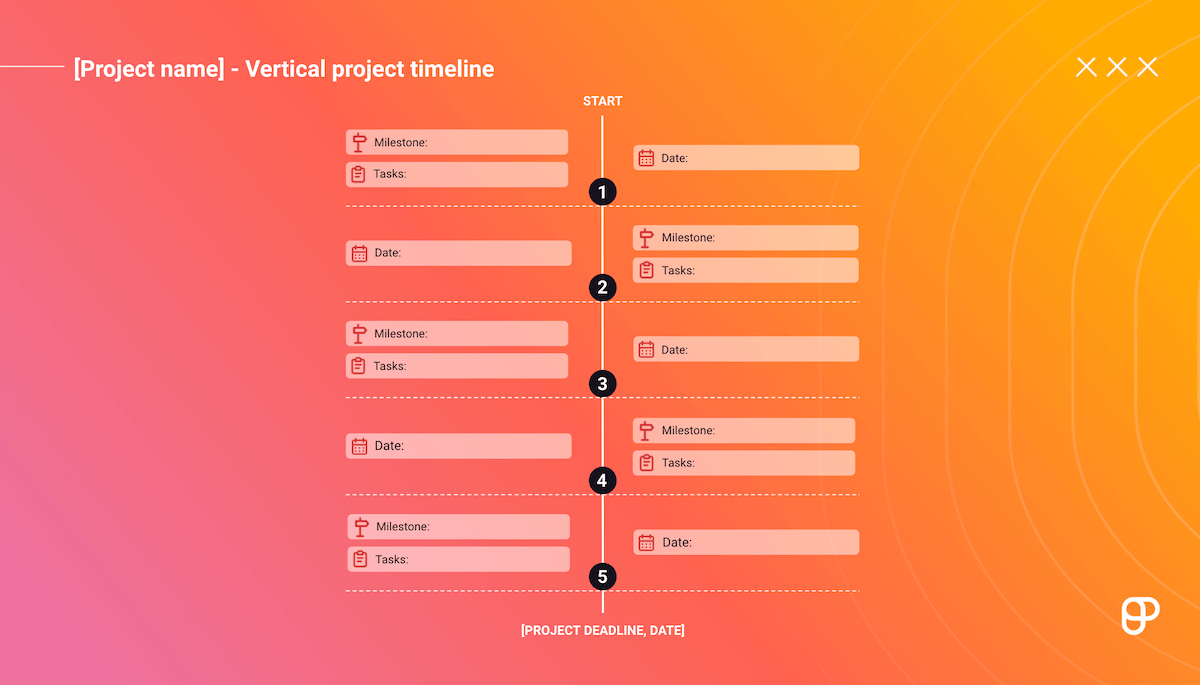
Vertical chart timeline
This type of timeline lays out all tasks and milestones vertically and shows task progress/data change over time.
A vertical chart timeline is most suitable for projects that deal with data-driven tasks, such as marketing and finance projects.
For example, we can use it to demonstrate:
- The traffic our website generates over time,
- Monthly, weekly, and annual lead generation rates, or
- Our company’s monthly recurring revenue (MMR) and annual recurring revenue (ARR).
This chart consists of groups of tasks, milestones, and dates. For each milestone, you can write down the tasks that need to be completed and the date by which the milestone should be reached.
This way, there’s a clear overview of what needs to be done to achieve each milestone.
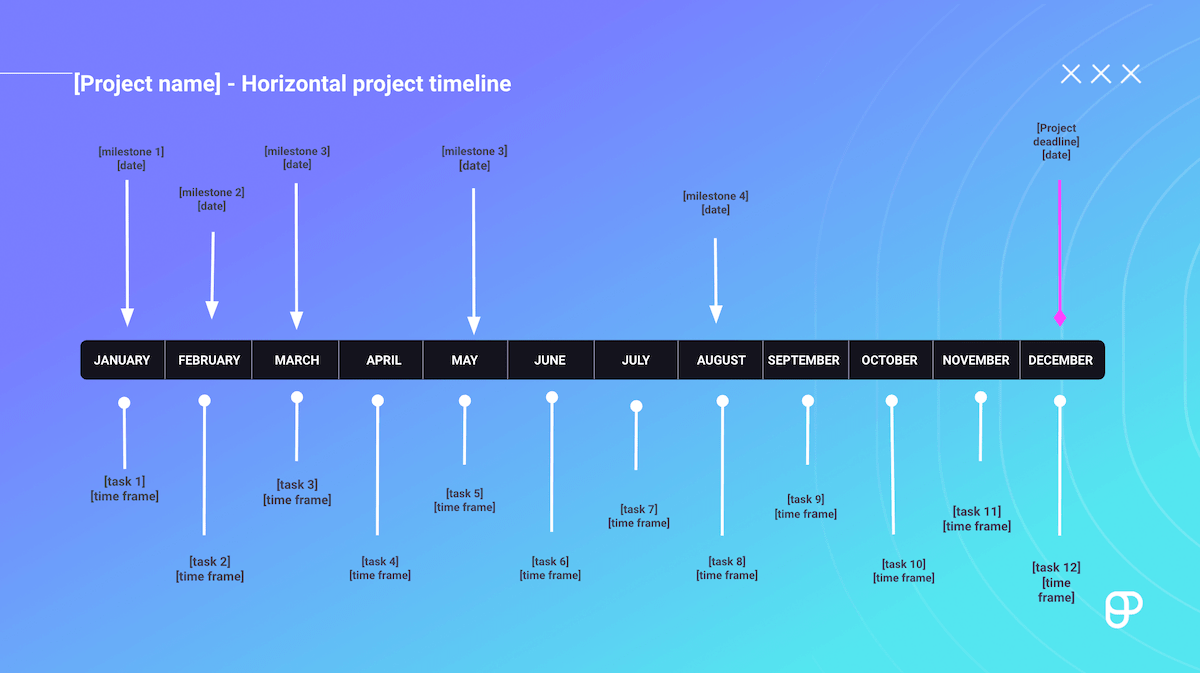
Horizontal chart timeline
This type of chronological timeline displays tasks and milestones on a horizontal axis.
It is best used for presenting tasks that have Start-to-Finish task dependencies, like manufacturing a product, from the creation process, over quality inspection and packaging, to delivery of the product.
This example consists of:
- A horizontal timeline divided into months,
- Milestones written above the line with arrows pointing to a point on the timeline,
- Tasks written under the line with arrows pointing up to a point on the timeline, and
- An arrow marking the project deadline.
Each of these arrows can be dragged and dropped at the desired place on the timeline to create personalized horizontal chart timeline.
💡 PLAKY PRO TIP
Get the horizontal project timeline, the yearly and monthly Gantt charts, and browse other timeline templates in Word, Excel, Power Point, Google Docs and Google Sheets, here:
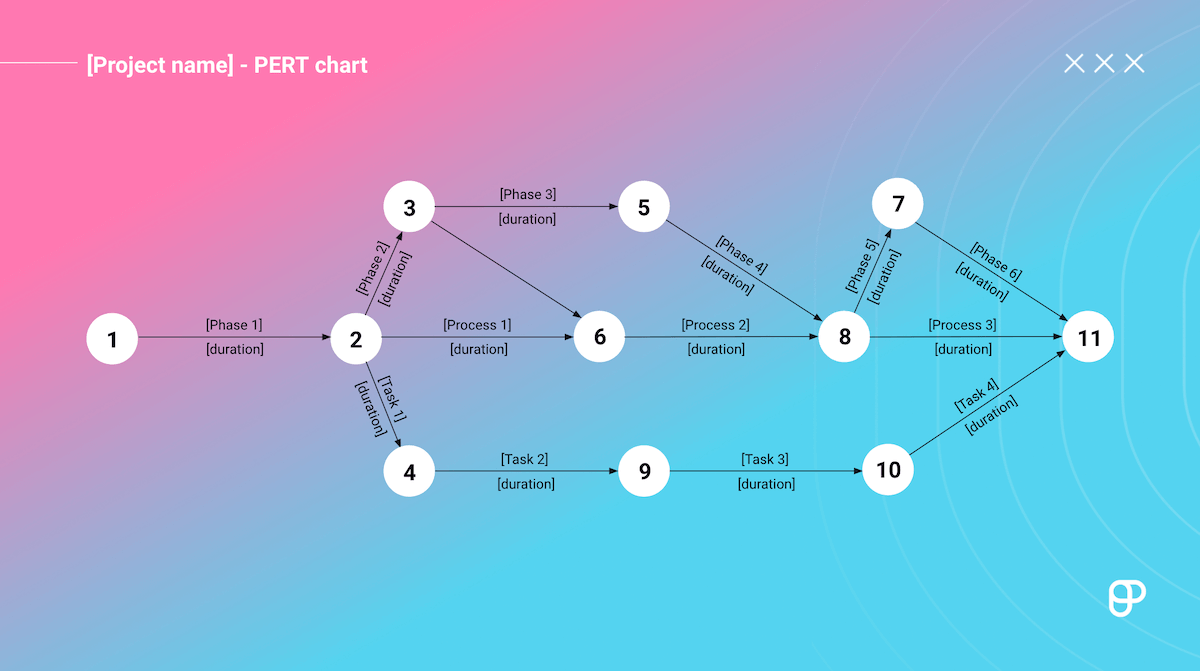
#4 PERT chart timeline
If you find it challenging to map project tasks or track task dependencies, you should try a PERT chart.
It comes in handy for more complex projects with many related tasks and procedures.
Program Evaluation and Review Technique (PERT) chart can be used to:
- Organize, schedule, and map out tasks within a project,
- Provide task duration estimates, and
- Visually represent task dependencies.
A PERT chart uses circles or rectangles called nodes to display project events or milestones.
These nodes are connected by vectors or arrows that show various tasks.
This PERT chart consists of:
- Nodes representing project milestones, and
- Arrows representing project phases, processes, and tasks.
When filling out the chart first write down milestones with corresponding numbers in the notes section.
Then define your relevant phases, processes, and tasks along with their duration and write them on the arrows in the chart.
This way, you will have a clear visual representation of all the dependencies in your project.
Now, let’s take a look at the benefits of having a project timeline.
The benefits of a project timeline
Having a project timeline has many benefits. It’s very useful, since it:
- Provides a visual overview of a project,
- Reveals task dependencies,
- Displays every team member’s workload,
- Keeps everyone in the loop, and
- Makes the project processes transparent.
Let’s take a look at each benefit separately.
#1 A project timeline provides a visual overview of a project
To stay on track with a project, you need to keep an eye on the big picture.
A project timeline enables everyone working on a project to focus their attention on the project’s goal by visualizing everything important in a single view.
It helps project managers get a bird’s eye view of the project without going into the details.
Everyone on the team can get a clear picture of the project status by simply taking a look at the project timeline. It displays tasks, dependencies, and deadlines and pinpoints people working on particular tasks.
#2 A project timeline reveals task dependencies
A project timeline includes all the upcoming tasks and identifies what needs to be done and when.
However, tasks are often tied together, and some of them need to be finished first before you can start working on others. These relationships between tasks are called task dependencies.
Identifying task dependencies helps avoid blockages that may delay a project. This is particularly practical in complex projects with multiple phases and many correlated tasks.
Displaying dependencies in a project timeline allows us to foresee how a delay in one specific task can affect the entire project.
#3 A project timeline displays everyone’s workload
A project timeline provides an overview of project tasks and shows who is assigned to which one. It is great for tracking the amount of work every project team member will have assigned to them in a specific period.
This way, project managers can keep track of everyone’s workload and distribute tasks so they don’t overburden individual team members.
#4 A project timeline keeps everyone in the loop
A project timeline is an excellent visibility tool that lets everyone involved in a project:
- Easily track task progress,
- See what different teams are currently working on, and
- See the current project status.
Keeping everyone in the loop makes project communication easier. It builds trust between stakeholders and team members working on the project.
#5 A project timeline makes the project processes transparent
A project timeline boosts transparency as it summarizes tasks, dependencies, and milestones, and pinpoints team members working on particular tasks.
It reveals what lies ahead so everyone involved has insight into where they stand with the project and what the next steps are.
An example of a project that needs a timeline
A project timeline is helpful for every project, especially more complex ones.
Let us look at an example of how you can create a timeline for a large project — developing a custom CRM software solution for your company.
The development process may consist of the following stages:
- Stage #1: Setting the budget, determining requirements, and preparing the design,
- Stage #2: Developing basic features,
- Stage #3: Developing more advanced features,
- Stage #4: Ensuring GDPR compliance and data entry,
- Stage #5: Testing, and
- Stage #6: Deployment and launch.
Every stage consists of a list of tasks you need to complete.
#1 Setting the budget, determining requirements, and preparing the design
At the beginning of any project, you have to determine the project budget.
As there are many types of CRM software, you also have to choose the one that suits your needs the best.
After that, you will be able to choose the right technology for the development process, and your design team can start working on design proposals.
Here are the tasks you should complete at this project stage:
- Determine the budget for your project,
- Choose the type of CRM that would suit you and specify technical requirements,
- Choose the right technology stack for your project, and
- Prepare UI/UX design and wireframes.
You should also set start and end dates for each task, appoint team members, and identify task dependencies.
Your tasks may look like this:
| Tasks | Start date | End date | Team | Dependências |
|---|---|---|---|---|
| Task 1: Determine the budget | September 9, 2023 | September 13, 2023 | Finance department | / |
| Task 2: Choose the type of CRM and specify technical requirements | September 16, 2023 | September 27, 2023 | Product marketing and Business development | Budget |
| Task 3: Choose the right tech stack for your project | September 30, 2023 | October 10, 2023 | Desenvolvimento | Budget, the type of CRM, and technical requirements |
| Task 4: UI/UX design and wireframes | September 30, 2023 | November 13, 2023 | Design | Type of CRM and technical requirements |
Then, you want your team to focus on developing basic CRM features.
#2 Develop basic features
The basic features you want your team to develop first may include:
- Contact management,
- Lead management,
- Gerenciamento de tarefas
- Dashboards,
- Analytics and reports,
- File sharing, and
- Calendar and reminders.
When everything is defined, your tasks may look like this:
| Tasks | Start date | End date | Team | Dependências |
|---|---|---|---|---|
| #1: Contact management | December 14, 2023 | December 28, 2023 | Desenvolvimento | Technology stack, UI/UX design, and wireframes |
| #2: Lead management | December 29, 2023 | January 12, 2024 | Desenvolvimento | Technology stack, UI/UX design, and wireframes |
| #3: Task management | January 15, 2024 | January 26, 2024 | Desenvolvimento | Technology stack, UI/UX design, and wireframes |
| #4: Dashboards | January 29, 2024 | February 9, 2024 | Desenvolvimento | Technology stack, UI/UX design, and wireframes |
| #5: Analytics and reports | February 12, 2024 | February 30, 2024 | Desenvolvimento | Technology stack, UI/UX design, and wireframes |
| #6: File sharing | February 3, 2024 | February 14, 2024 | Desenvolvimento | Technology stack, UI/UX design, and wireframes |
| #7: Calendar and reminders | February 17, 2024 | February 28, 2024 | Desenvolvimento | Technology stack, UI/UX design, and wireframes |
After developing the basic features, you may want to expand the CRM functionalities by adding more advanced features.
#3 Develop more advanced features
More advanced CRM features may include the following:
- Sales pipeline,
- Lead scoring,
- Email templates and scheduling,
- Invoicing,
- Chatbot integration, and
- Third-party integrations.
Let’s take a look at the tasks you should complete during this stage.
| Tasks | Start date | End date | Team | Dependências |
|---|---|---|---|---|
| #1: Sales pipeline | February 31, 2024 | March 18, 2024 | Desenvolvimento | Technology stack, UI/UX design, and wireframes |
| #2: Lead scoring | March 21, 2024 | April 2, 2024 | Desenvolvimento | Technology stack, UI/UX design, and wireframes |
| #3: Email templates and scheduling | April 5, 2024 | April 22, 2024 | Desenvolvimento | Technology stack, UI/UX design, and wireframes |
| #4: Invoicing | April 25, 2024 | May 13, 2024 | Desenvolvimento | Technology stack, UI/UX design, and wireframes |
| #5: Chatbot integration | May 16, 2024 | May 20, 2024 | Desenvolvimento | Technology stack, UI/UX design, and wireframes |
| #6: Third-party integrations | May 2023, 2024 | June 3, 2024 | Desenvolvimento | Technology stack, UI/UX design, and wireframes |
#4 GDPR compliance and data entry
Just as with any software solution, you need to ensure you are GDPR-compliant before going into the software testing phase.
Here are the tasks you should complete during this stage:
| Task | Start date | End date | Team | Dependências |
|---|---|---|---|---|
| #1: The Consent Management Platform (CMP) integration | June 6, 2024 | June 10, 2024 | Desenvolvimento | Ferramentas |
| #2: Data entry | May 23, 2024 | June 24, 2024 | Sales, and Marketing | Ferramentas |
#5 Testing
Then, you must ensure everything works according to plan. Therefore, you need to test your newly developed software.
You have only one task, but it is a critical one.
| Task | Start date | End date | Team | Dependências |
|---|---|---|---|---|
| Software testing | June 27, 2024 | July 31, 2024 | QA | Features, and Data entry |
#6 Deployment and launch
If everything functions as planned, the following steps are:
- Deployment, and
- Launch.
| Task | Start date | End time | Team | Dependências |
|---|---|---|---|---|
| Deployment | August 3, 2024 | August 4, 2024 | Desenvolvimento | Features,Data entry, and testing |
| Launch | August 5, 2024 | August 5, 2024 | Desenvolvimento | Deployment |
Last but not least — don’t forget to set milestones and mark specific points along a project timeline.
Set project milestones along the way
This part is not a specific stage, but project milestones should be set when convenient. The milestones for our CRM development project may be the following:
- The budget is defined: October 13, 2023
- The type of CRM and technical requirements are specified: October 27, 2023
- UI/UX design and wireframes are prepared: December 13, 2023
- Basic features are developed: March 28, 2023
- Advanced features are developed: June 3, 2024
- The Consent Management Platform (CMP) is integrated: June 10, 2024
- Data entry is completed: June 24, 2024
- Testing is completed: July 31, 2024
- Deployment is finished: August 4, 2024
- Launch date: August 5, 2024
There’s a lot of data, and you should have it in one place.
For this purpose, we recommend using project management software.
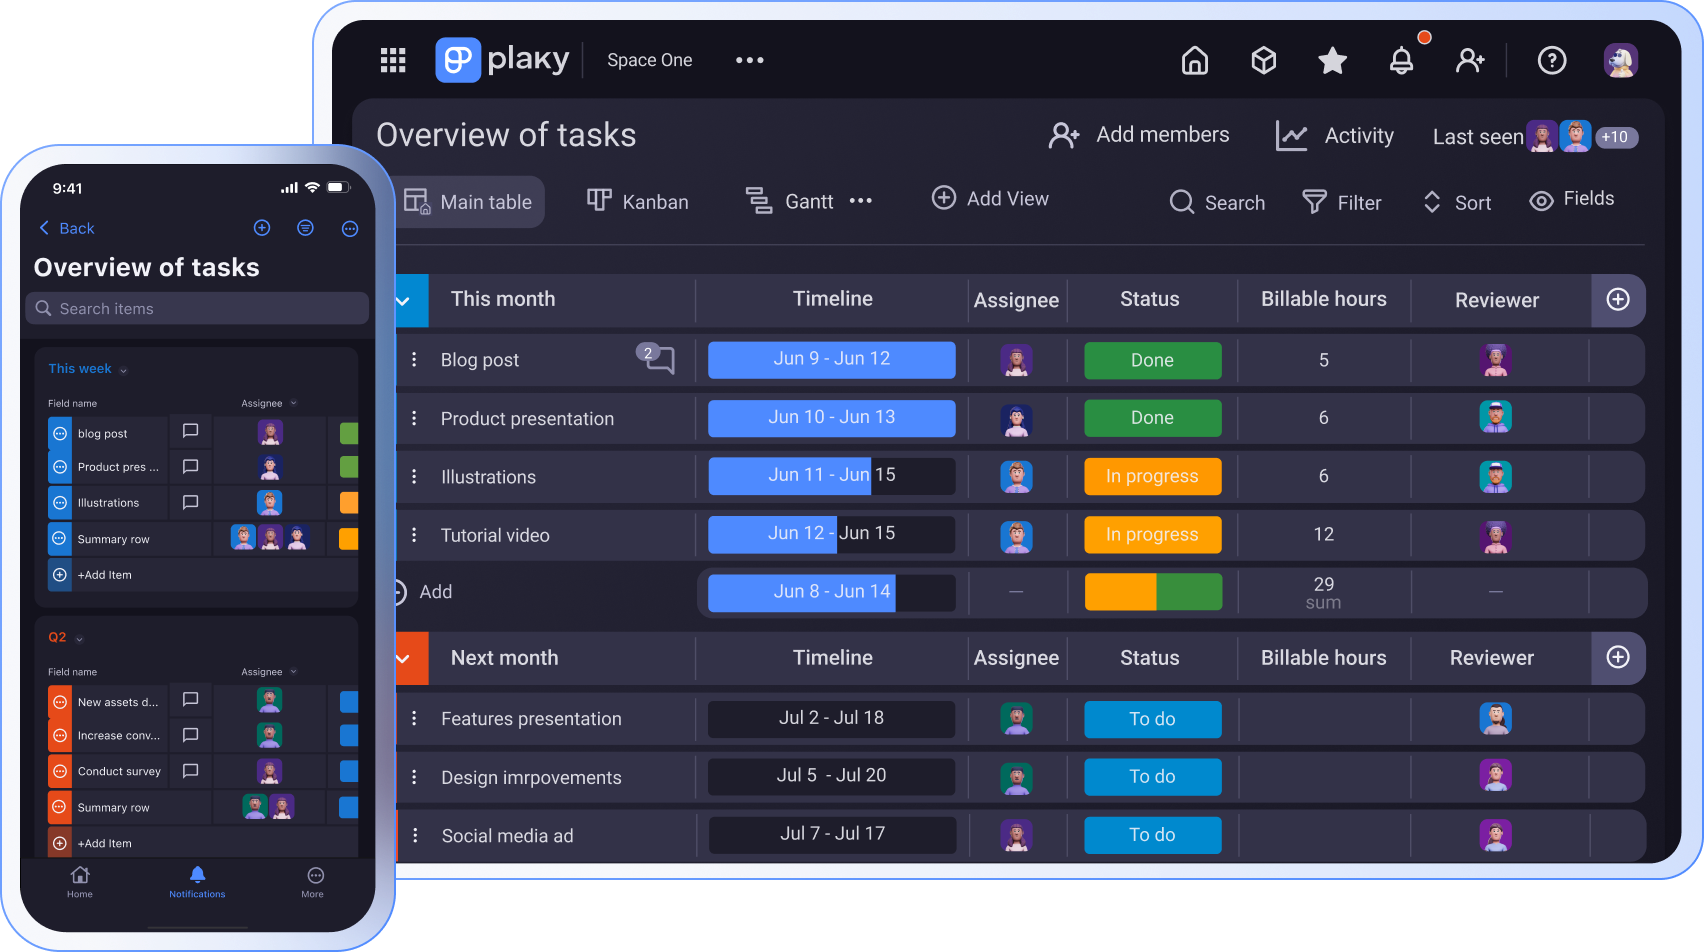
How to create a project timeline in Plaky
Now, it’s time to see how the project timeline that incorporates the data mentioned above may look in Plaky project planning software.
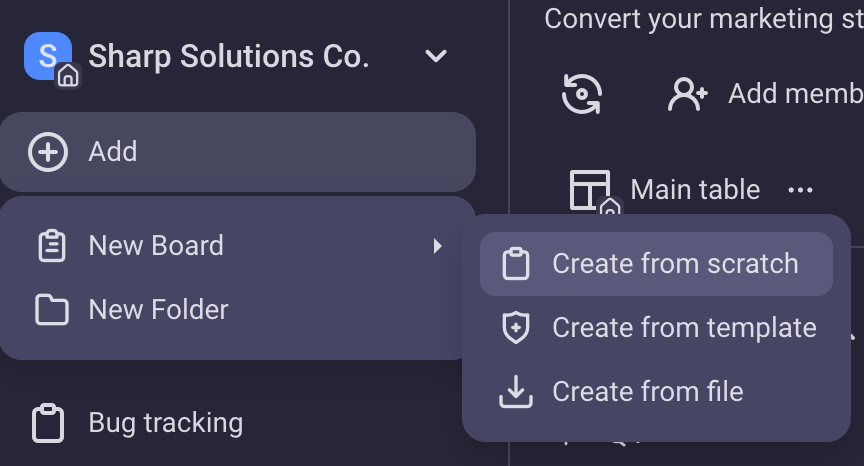
First, you need to add a new board within a space — a virtual space where you organize your project.
Navigate to the space menu at the top left corner, click +Add, and choose if you want to add a new board from scratch or from a template.
This newly created board can be configured and adjusted to suit your project needs.
You can choose between 3 types of board views:
- Table view,
- Kanban view, and
- Gantt view.
In this example, we will first use the Table view.
After creating the board, we need to add item (i.e. task) groups.
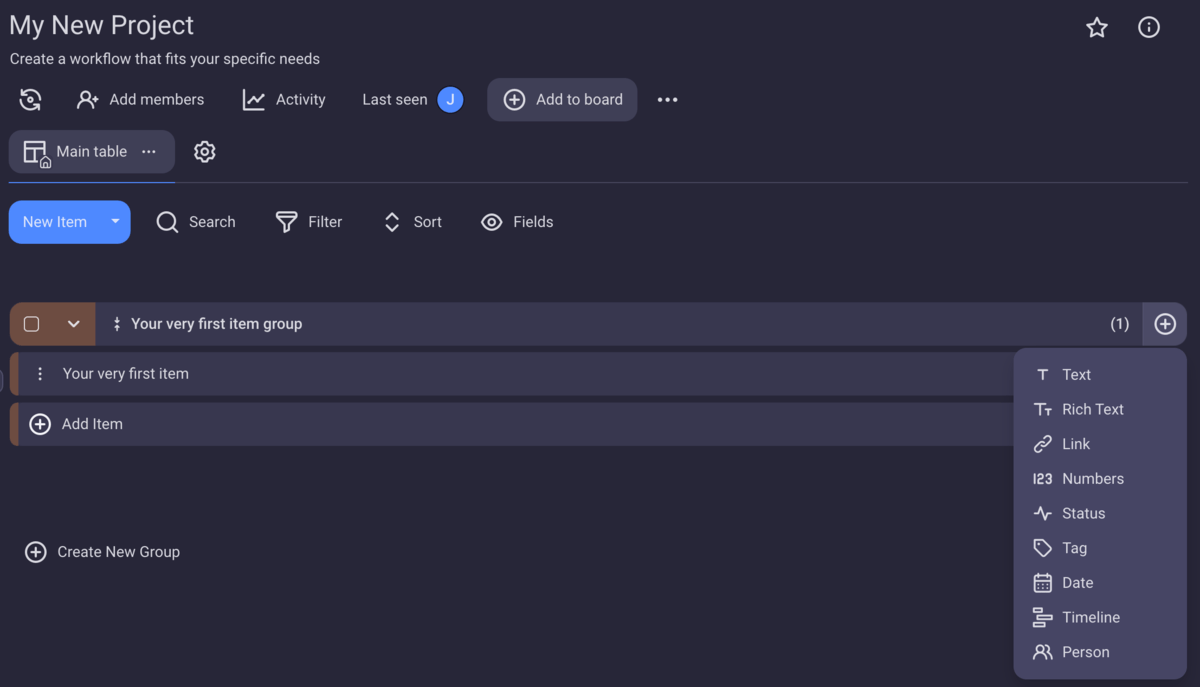
Various field types can be added to an item, such as:
- Person,
- Text,
- Status,
- Date,
- Tag,
- Number, etc.
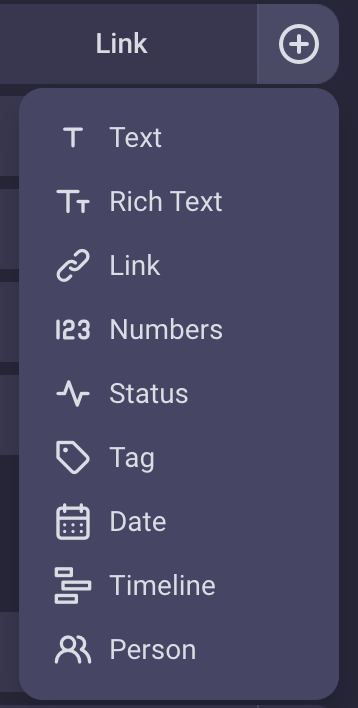
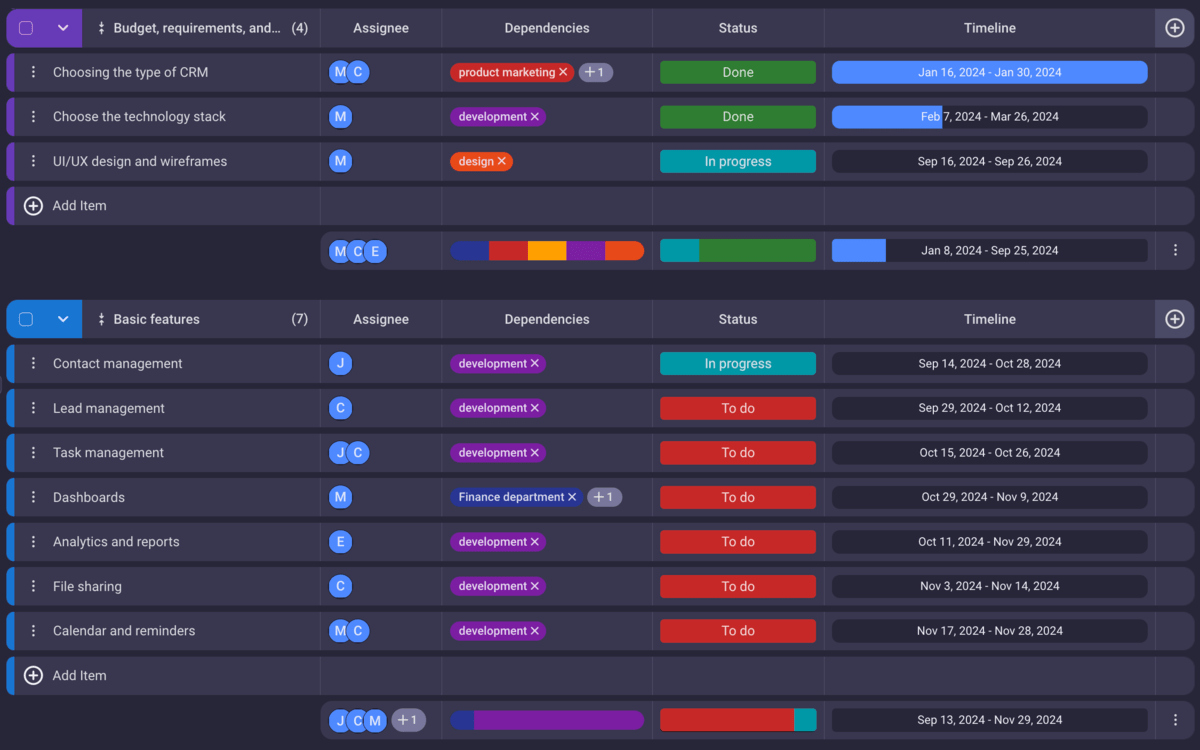
When creating a project timeline, you can add a Person field with assignees and a Tag field where you can add dependencies.
You can also add a Status field to mark projects as “To do”, “In progress”, “Done”, etc.
But the most important for creating a project timeline is the Timeline field.
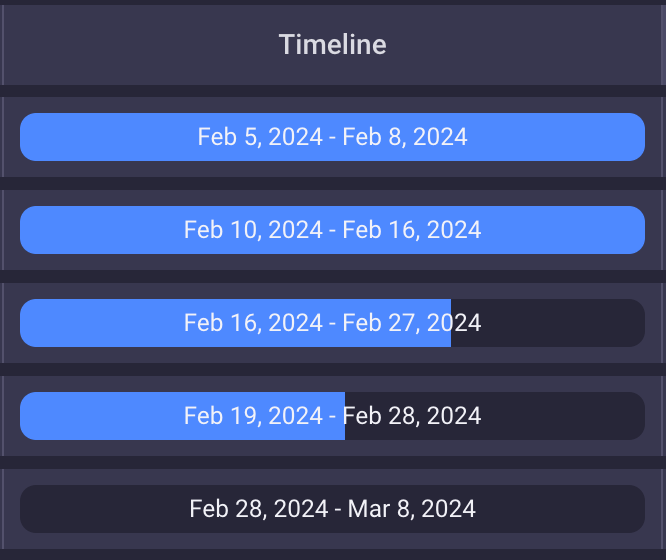
This field includes the start and end dates of a task written in the field, but at the same time shows how far along you’ve come with the said task.
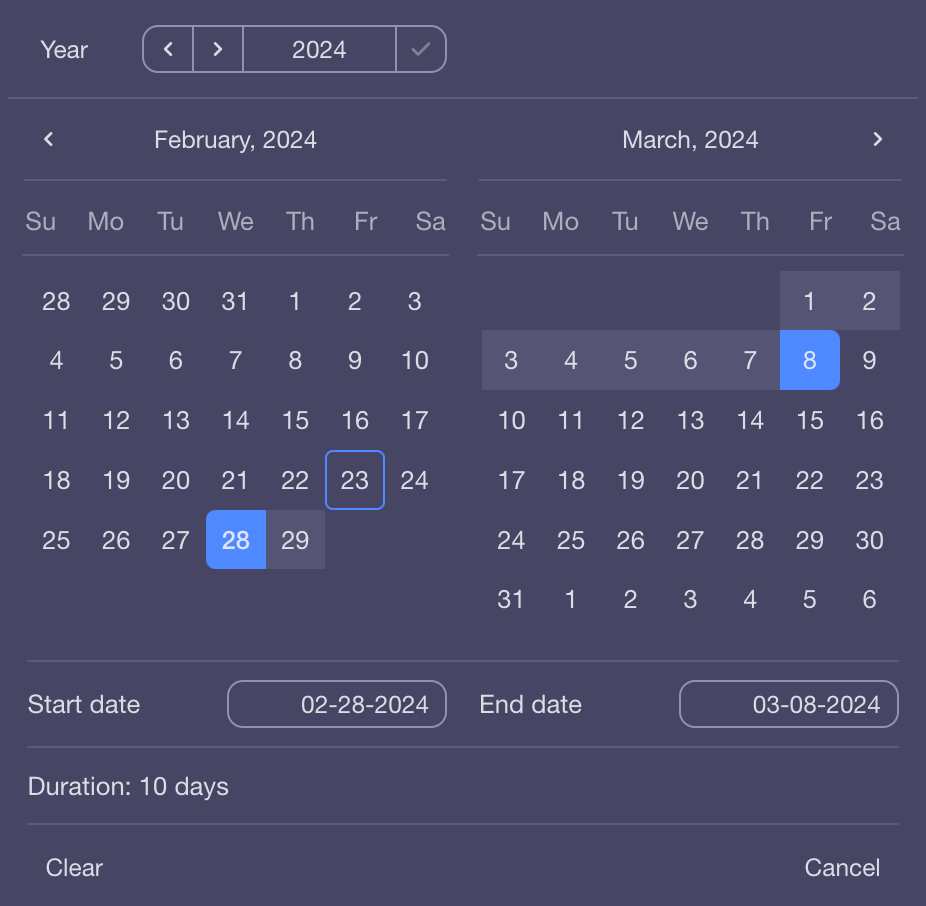
When you click on the field it will give you the option to choose the start and end date of the task.
Once you have entered the information, you will have a visual representation of each task’s timeline. At the bottom of the task group, you can add a summary row, which will show you the timeline of the entire group of tasks.
In the end, your project timeline will look like this:
If you want a view of all task timelines in relation to one another, you can add a Gantt View:
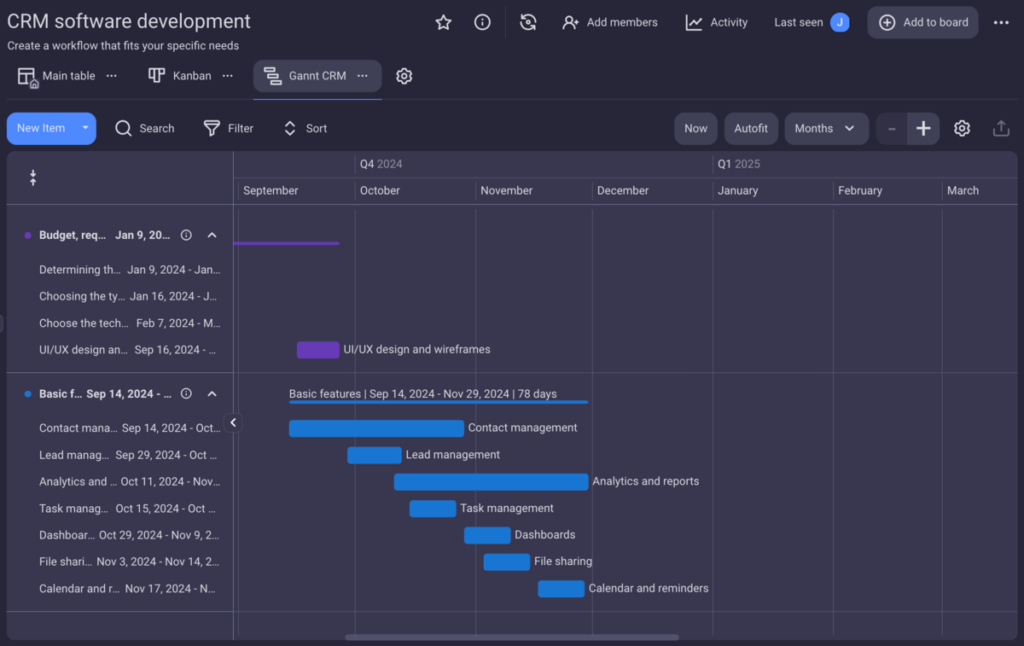
The time period in the Gantt chart is customizable. When you create the chart, the time period is set to weeks by default, but you can change it to hour, day, month, quarter, or year.
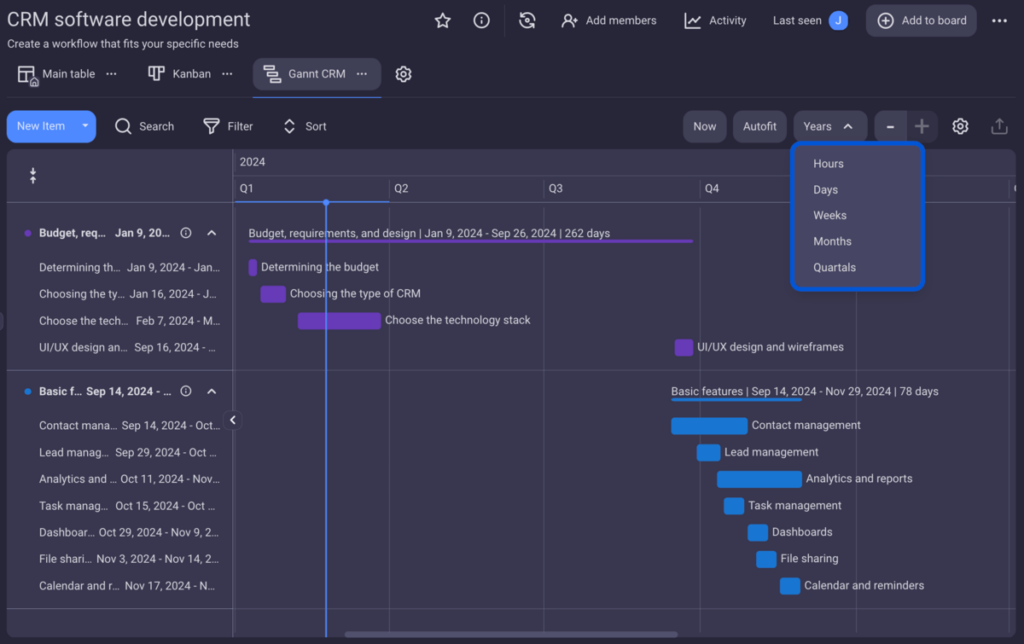
You can easily switch between the views with a single click depending on what you want to focus on.
FAQ about project timelines
If you find project timelines confusing, here are some FAQs to help clear things up.
What is a realistic timeline for a project?
Being realistic when you create a timeline for your project can save you a lot of pain later on.
Graf explains what you should include in your timeline, to make sure it’s realistic:
“A realistic project timeline is one that takes all the risks and contingencies into account.
It takes quite a few project planning activities to create a realistic project timeline. That includes, for example, breaking down the project scope, task estimation, and task dependencies. There will be contingencies, so make sure you plan for justified buffers.”
What is the difference between a project schedule and a project timeline?
A project schedule and project timeline are similar terms, so they can be easily mistaken. But the difference is the project schedule is broader than the project timeline.
A project timeline is a visual and focused tool that includes tasks, dependencies, milestones, and deadlines.
A project schedule represents a broader overview of the project, which includes the timeline itself, as well as additional information such as people assigned to the tasks, resources needed, etc.
📖 If there are more project management terms that confuse you and like your information presented in a comprehensive and easy-to-understand manner, check out our Project Management Glossary of Terms.
Visualize your projects effortlessly and increase productivity with Plaky
You’ve seen Plaky’s excellent task management features and how easily it allows you to transform a cluttered backlog into an easy-to-review, interactive Gantt chart.
In addition to this, Plaky allows you to:
- Create unlimited spaces, project boards, and items,
- Store all important information in one place,
- Communicate with teammates via task-specific comments,
- Share files effortlessly with no maximum storage limit,
- Have insight into a comprehensive activity log,
- Ensure transparency within the team and with external stakeholders, and more.
All in all, Plaky not only allows you to easily create an interactive, automated project timeline — it helps improve almost every aspect of your project management.
Ready to try it out for yourself? Create a free Plaky account today, try out its Gantt functionality and all the other premium features as part of a 14-day free trial — no commitment required!
Como revisamos esta publicação: Nossos redatores e editores monitoram as publicações e as atualizam quando novas informações são disponibilizadas, para mantê-las atualizadas e relevantes.