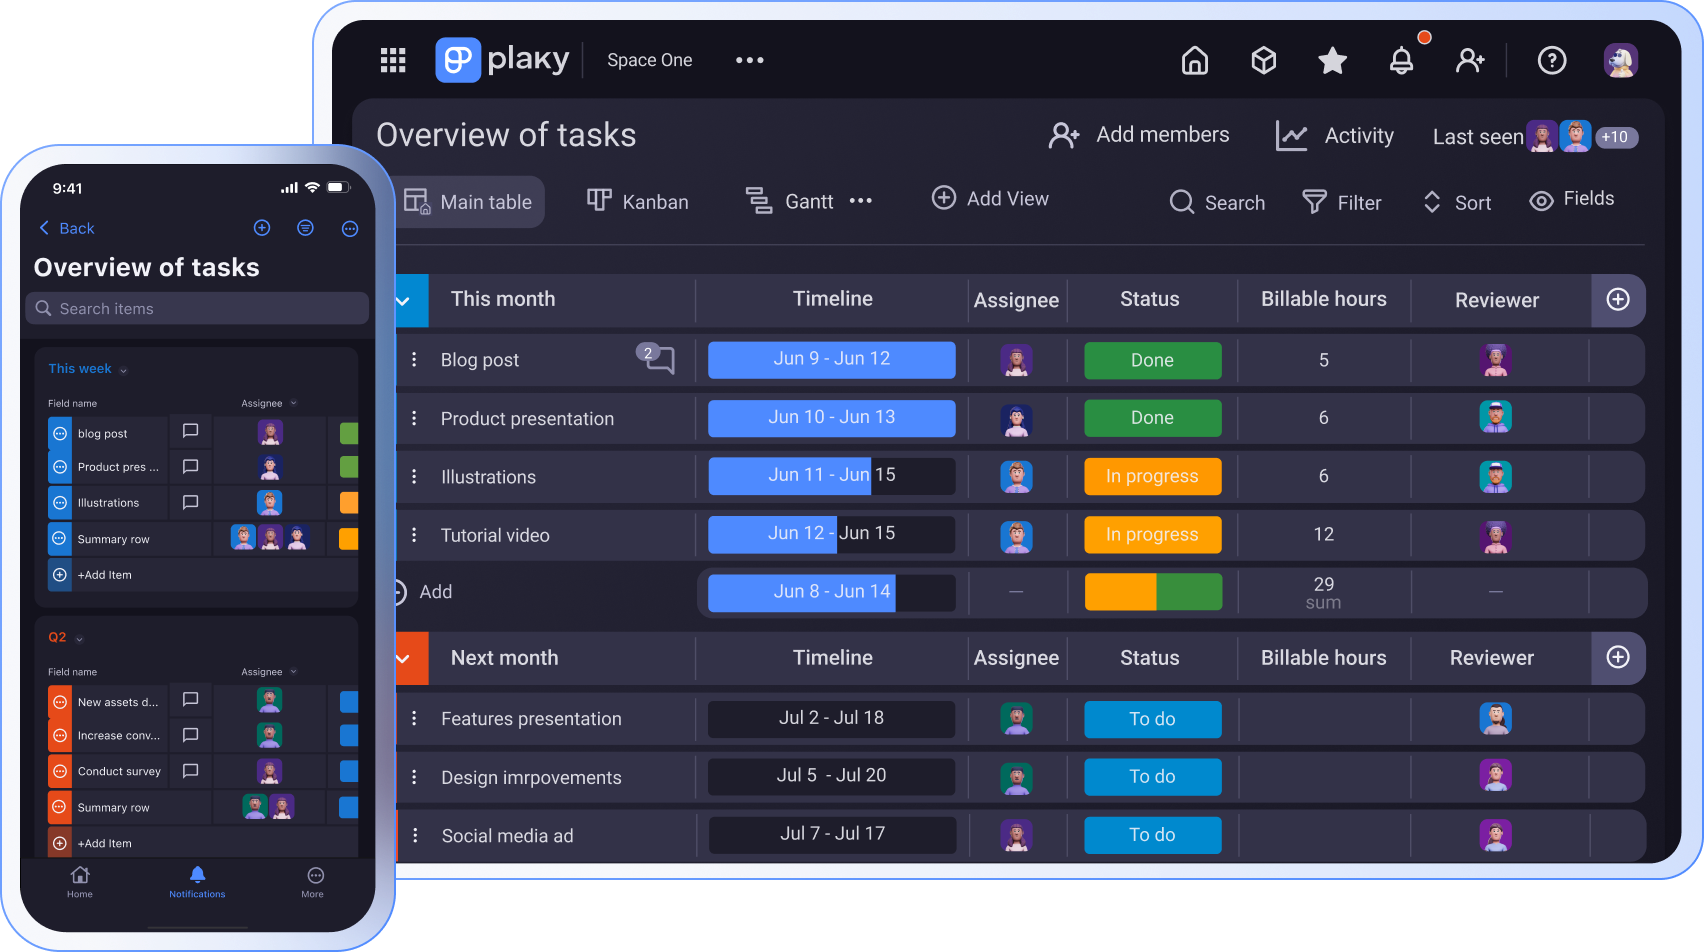
If you’re using only one view in Plaky thinking it’s enough, you are definitely missing out.
Learning how to organize a board with multiple views will help you look at your projects from different angles and notice patterns or issues you might otherwise miss.
So, instead of limiting yourself to just one type of project view, try switching between board views — Plaky has 4 powerful views to offer.
- Plaky’s boards can be viewed 4 different ways — as a Table, Kanban, Gantt, and Chart.
- In the Table view, you can oversee all tasks neatly organized into fields that help you easily spot important information such as task status or priority.
- With Plaky’s Kanban board you can visualize progress of all your projects and see how tasks move through the stages.
- Plaky’s Gantt Chart is the view intended for tracking project timelines and managing project schedules.
- Chart view simplifies complex data for you and gives you a visual representation of your project.
- You can create private views in Plaky, visible only to you.
One board — 4 angles
Having just one way to track your workflows is far from ideal — you feel restricted, and your creativity is confined to just one way of organization. You can even miss important information or overlook urgent tasks.
In Plaky, you can view data in 4 different ways — as a Table, Kanban, Gantt, and Chart. And, more importantly, there’s no limit to how many views you can create. For example, this means you can create a Kanban view that’s based on status, and another one that puts priority in focus for the same project.
Each view has its own perks, and depending on the role, different team members need different views for their daily work.
So, check out all the options you have in Plaky.
All-round view of projects in Plaky
Table view — default view
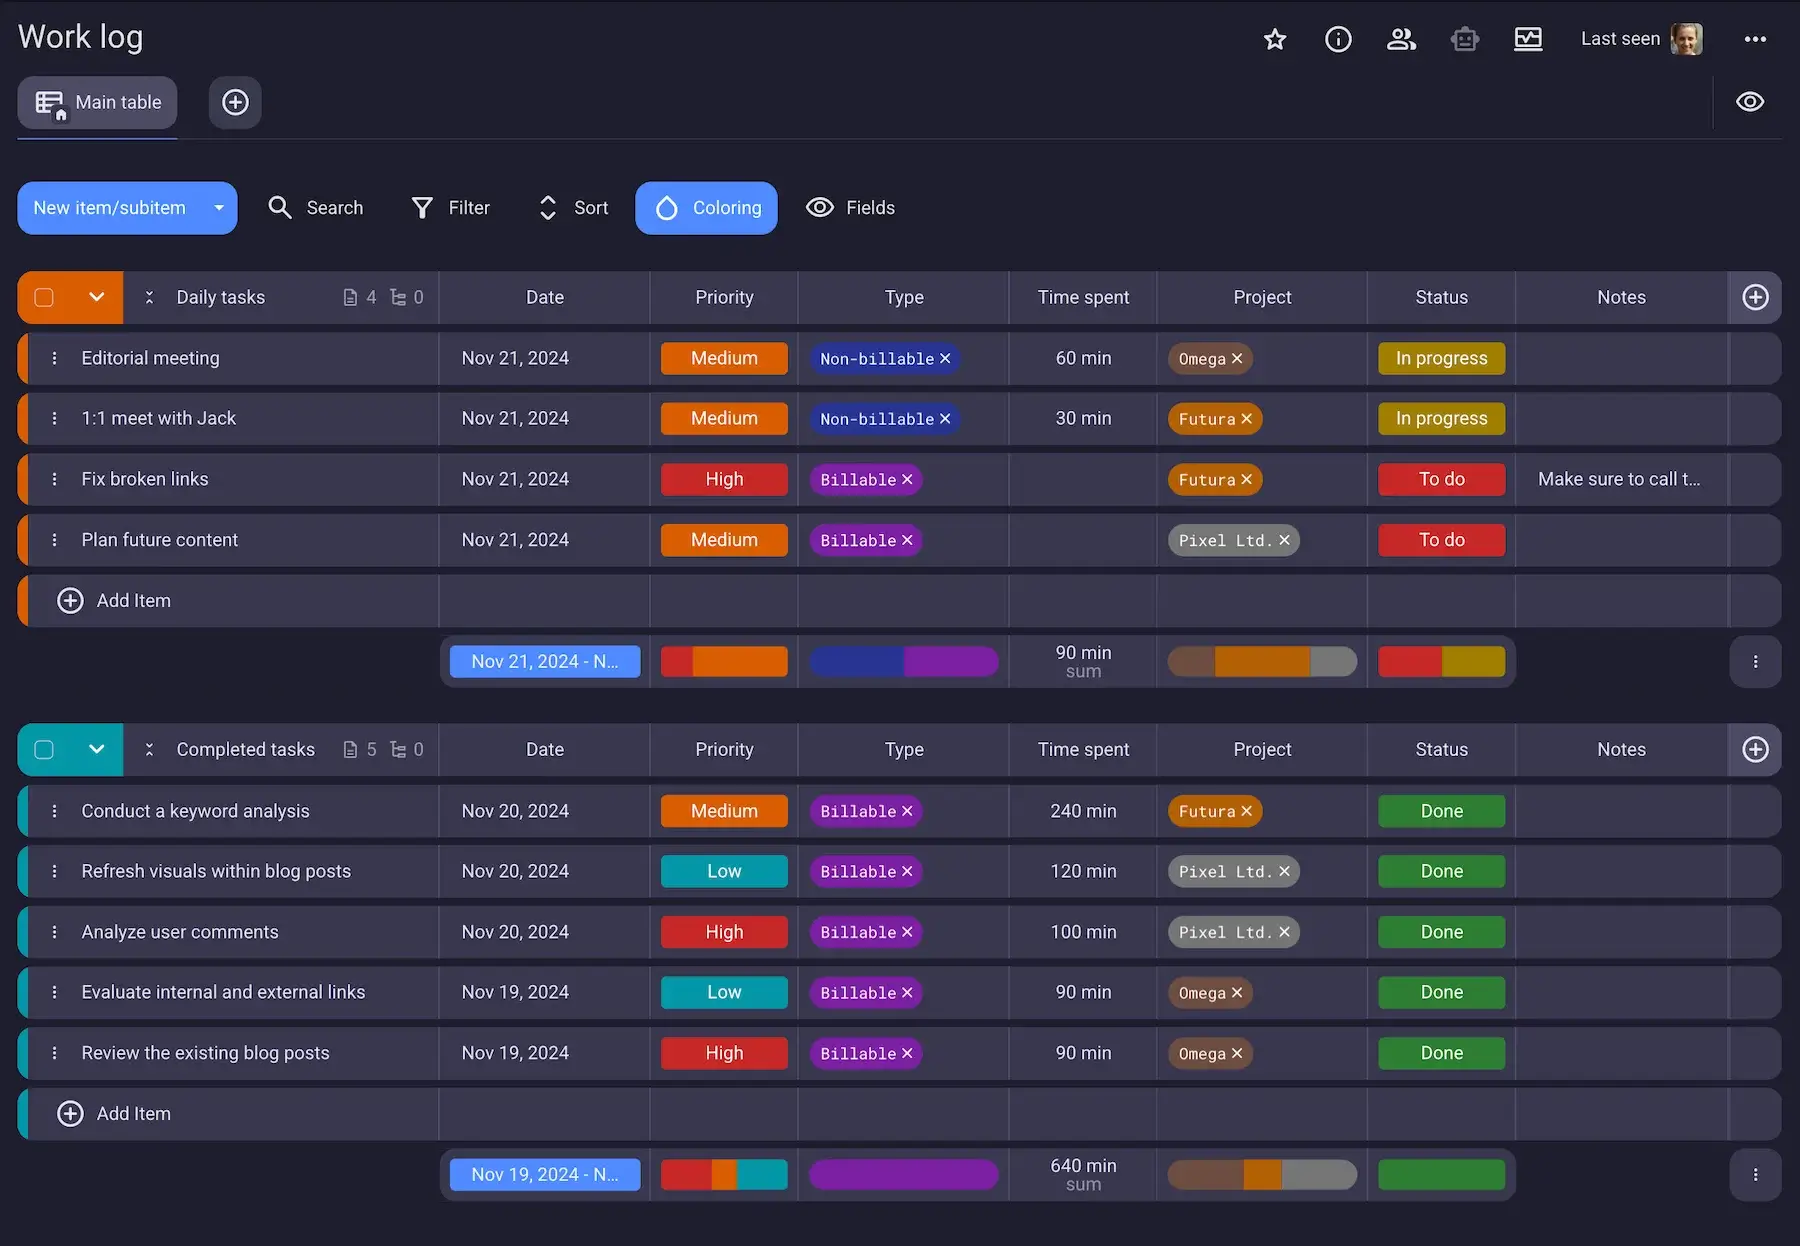
If you’re used to Excel sheets, Plaky’s Table view is a natural upgrade — it feels like a collaborative spreadsheet. You can view your data on a grid of tasks and fields, but also leave Comments to your team members and receive Notifications for any change.
Moreover, unlike Excel, where a single change can cause chaos and any more advanced functionality requires a formula, Plaky is adaptable and easy to navigate.
In the Table view, you can oversee all tasks neatly organized into colorful fields that help you easily spot important information such as task status or priority.
This makes Table view perfect for project overviews, raid logs, and client management.
Still, Table view is not perfect — that’s why we created additional options for you.
The Table view makes it difficult to see the timeline clearly, but that’s why Gantt charts exist.
Plus, if you track your project only in the Table view, you might miss potential bottlenecks. For this, you need a Kanban board.
Kanban view — see the flow and spot piled-up tasks
Tracking project progress is not easy when you need to keep an eye on your tasks’ progress individually.
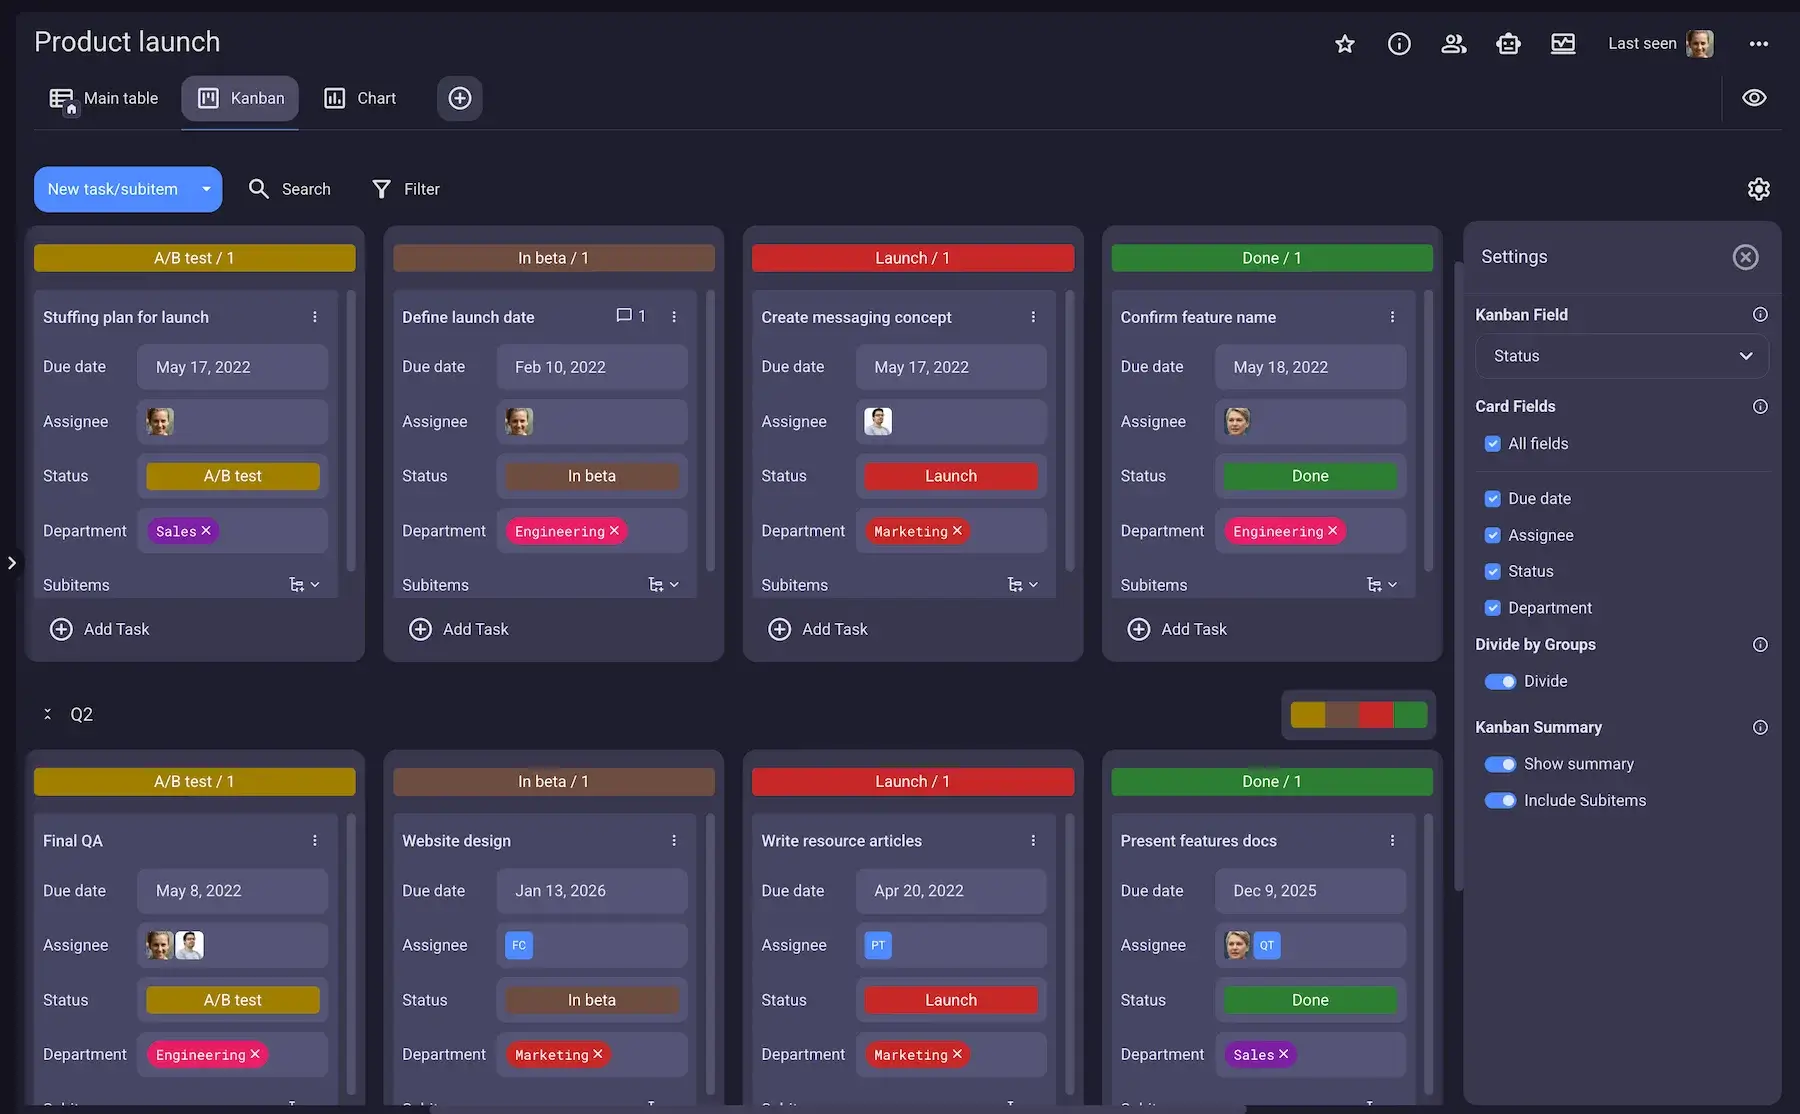
With Plaky’s Kanban board you can visualize progress of all your projects and see how tasks move through the stages. At a glance, you can see how many of your tasks are in progress, or done, and how many are waiting to be started.
When you get your board in Kanban view, you see tasks piling up in one column, such as Backlog or In progress. This way, you can rearrange tasks right away, instead of suddenly getting swamped with work. Alternatively, you can allocate more people to the busiest part of the project to prevent bottlenecks.
Kanban’s sticky notes design makes it easy to reorganize tasks — simply drag and drop tasks across the board.
Let’s see how Plaky Kanban view works with an example of a sales team that needs to organize their sales pipeline.
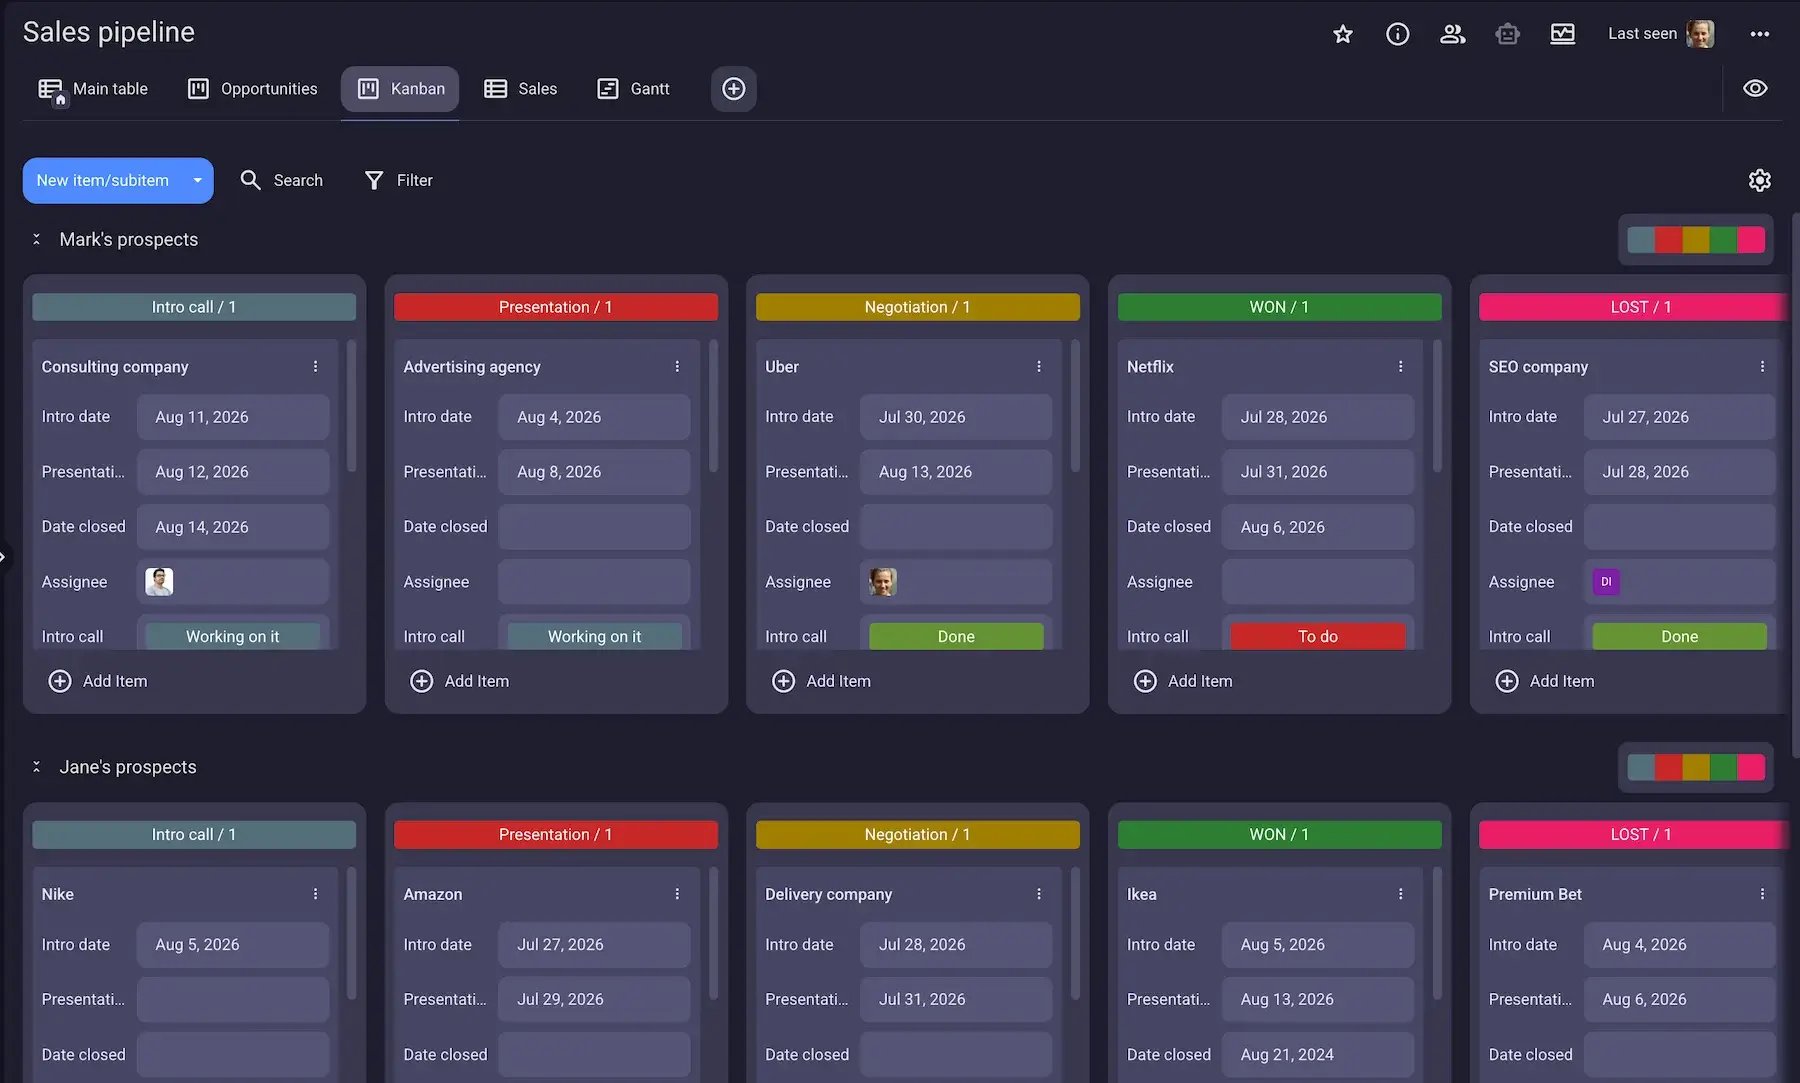
First, the sales manager has to fill the Table view with all the information, including a label field for prospects’ status. Then, they can create a Kanban view and set it up to classify prospects according to their status.
This way you can track which stage a prospect is in, such as:
- Intro call
- Presentation
- Negotiation
- Won
- Lost
- In review
With a clear distinction between stages, you can clearly see if there are too many tasks lingering in the negotiation stage and never seem to reach the “Won” category. Plus, it’s easy to shift the prospects through stages, naturally going from left to right as they progress.
Gantt chart view — catch overlapping deadlines before they collide
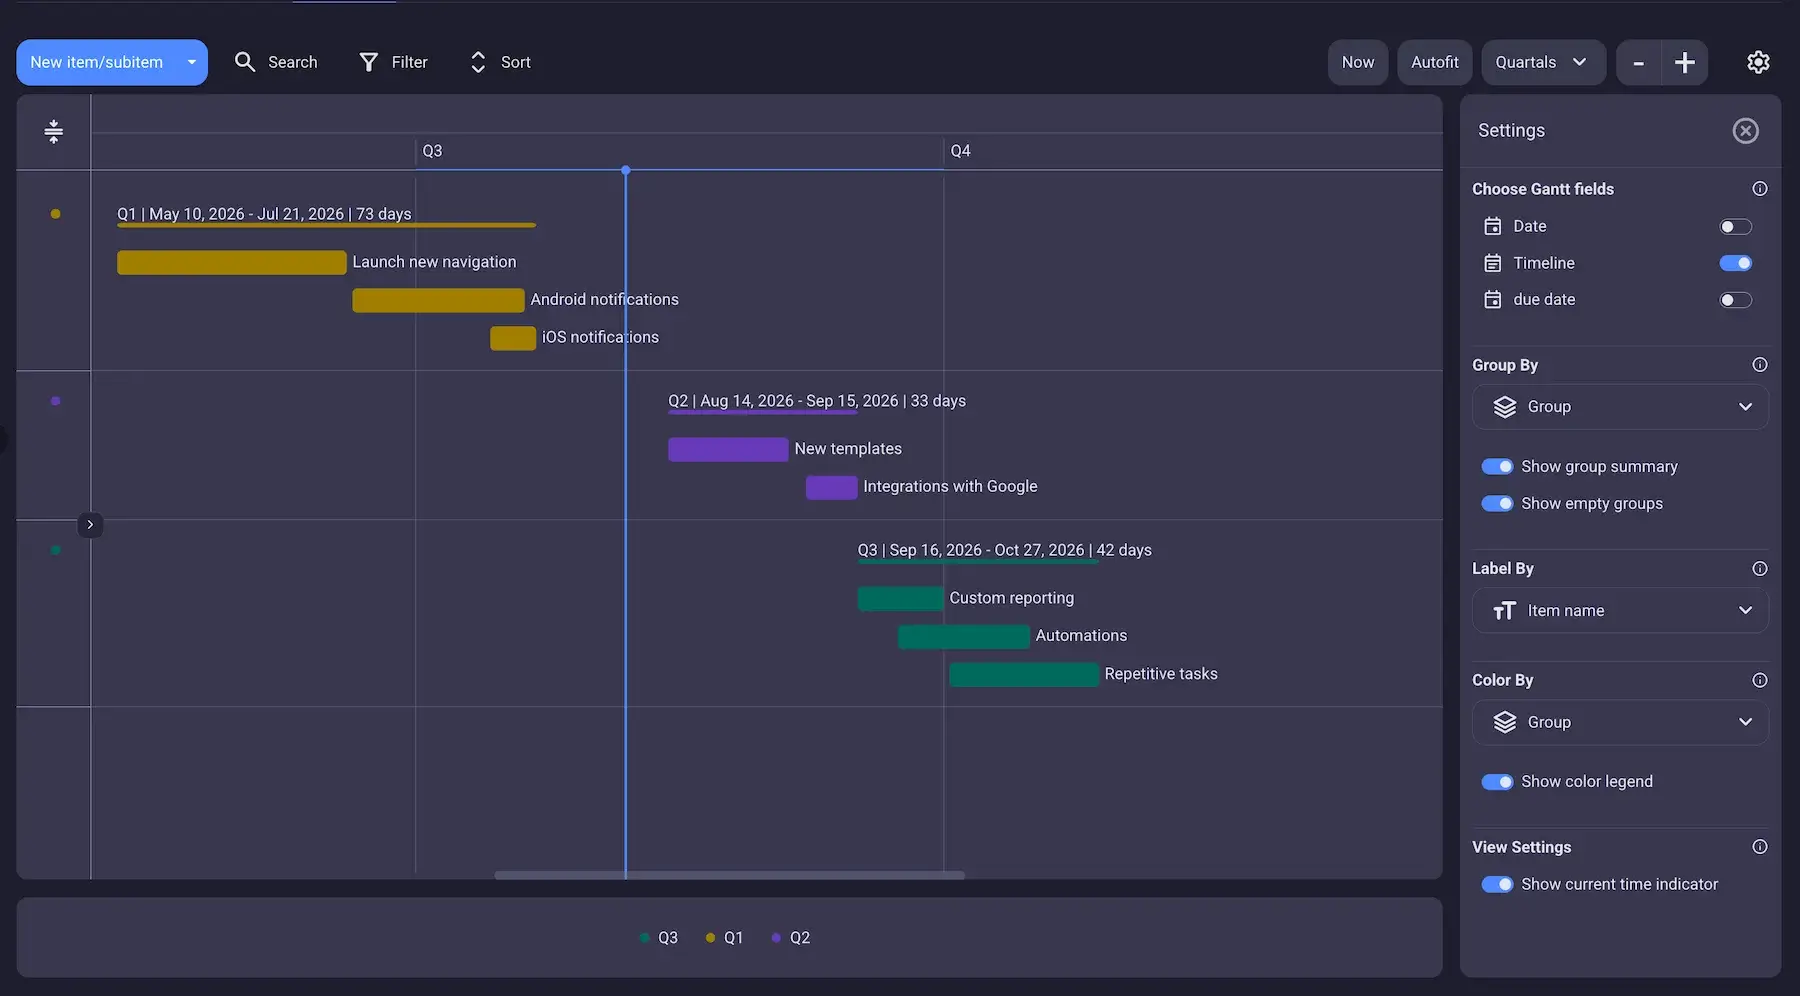
If you’re struggling with overlapping tasks you clearly need a good Gantt chart to help you manage tasks.
Plaky’s Gantt Chart is the view intended for tracking project timelines and managing project schedules. You can see your project on a custom timeline — simply decide on the time span you want to look at — days, months, weeks, quarters, or years.
For example, you can track day-to-day tasks on the level of a week or month. But, you can also have a yearly overview of your goals or long-term plans and tasks.
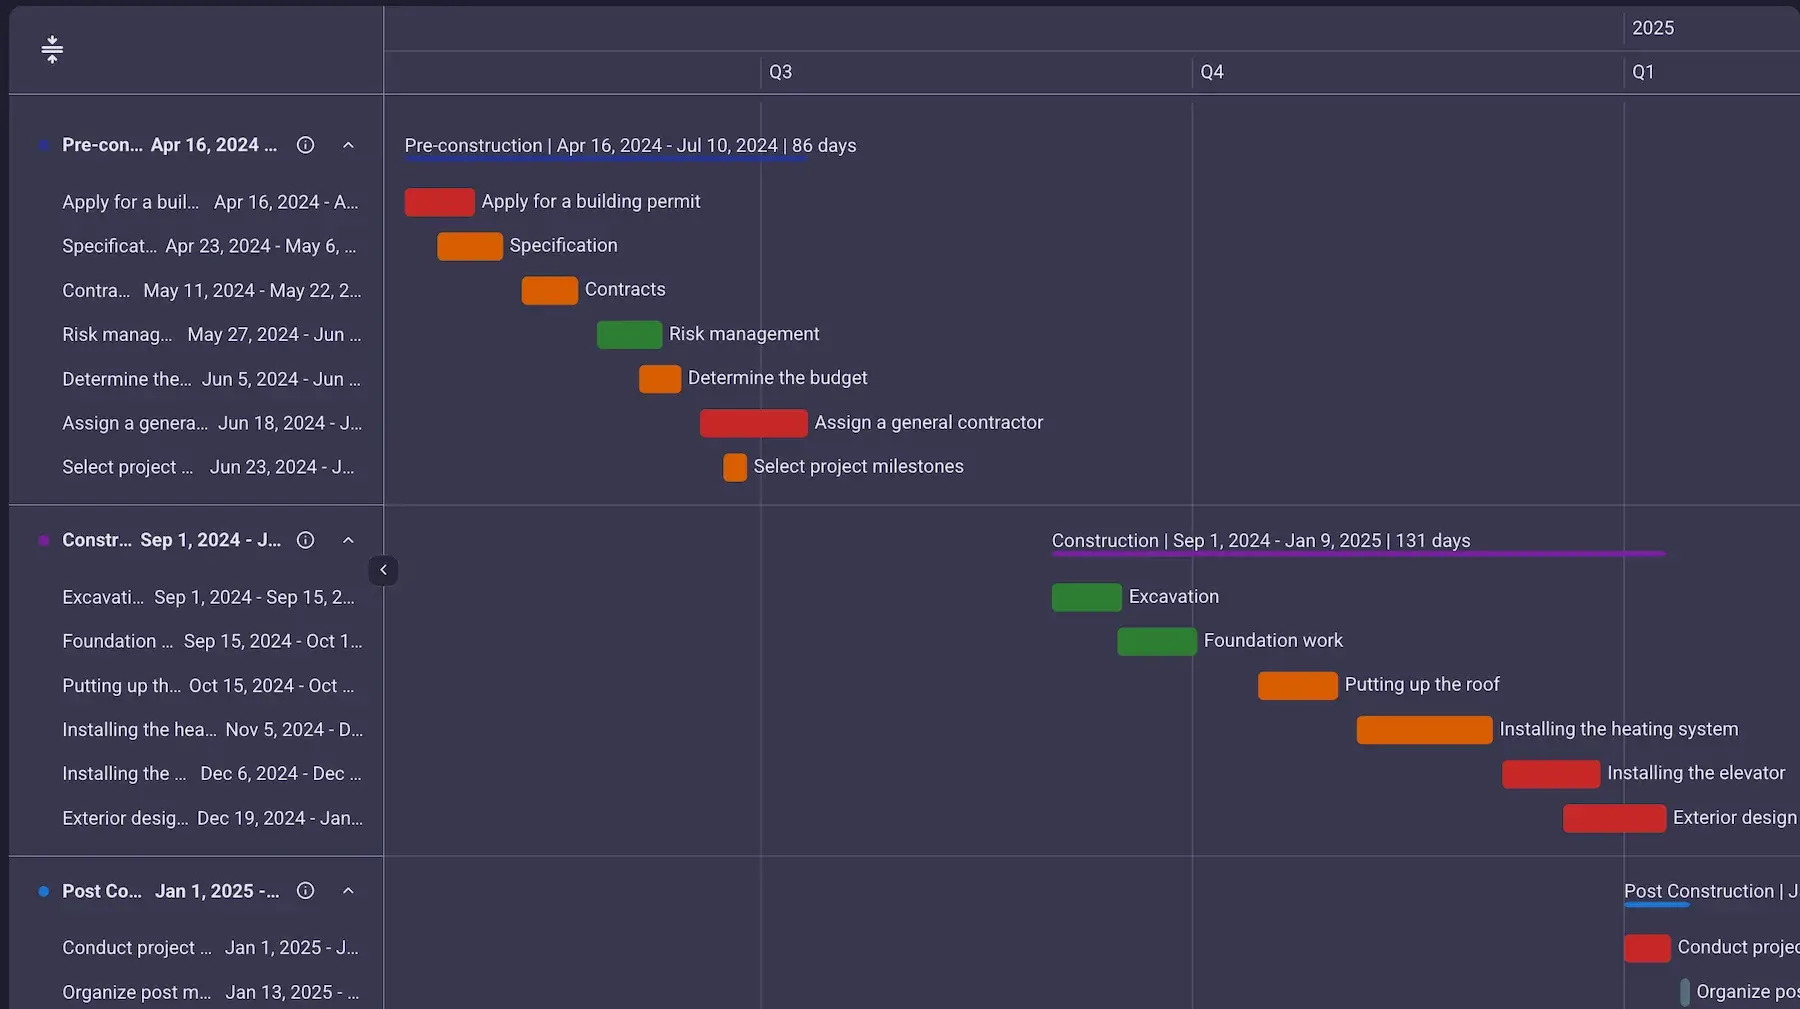
The best thing about the Gantt view is that it lets you see tasks overlapping with a single glance and adjust timelines without having to go back to the date fields in Table view. You can shorten and expend tasks or drag them across the timeline to improve your schedule right away.
For example, Plaky’s Gantt chart view is excellent for construction projects. In construction, tasks are very dependent on each other — you can’t, after all, start working on the roof, before you’ve built walls. So, simply listing tasks in a table isn’t enough. But, in a Gantt chart, you can see if all the tasks are in the right sequence, and spot any resource overruns.
💡 Dica profissional do Plaky
If you want a jumpstart to tracking project timelines, try one of our 11 free templates:
Chart view — stop eyeballing your team’s efficiency
The Chart view helps you visualize data and measure efficiency. You can look at a Table view all day, but not be able to analyze your project and see patterns like you can with Chart view.
Chart view simplifies complex data for you and gives you a visual representation of your project.
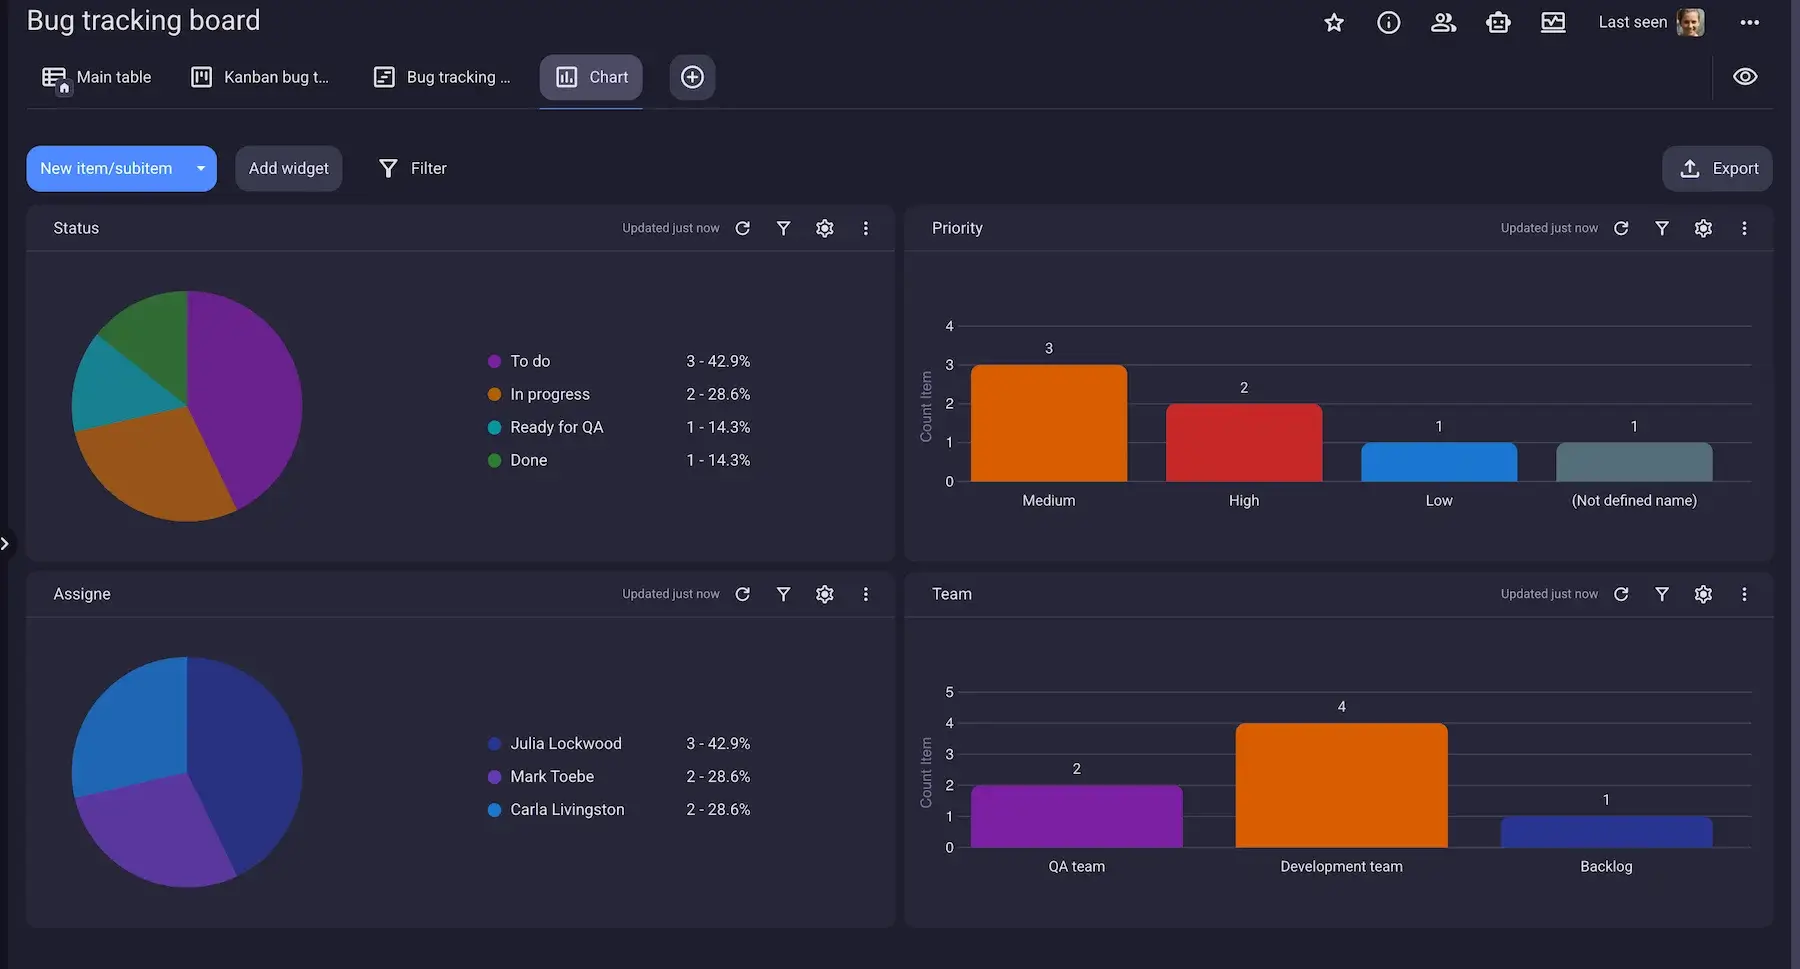
Let’s say you have a software company and you want to track your bug fix rates, Chart view will give you insights into:
- How many bug fixes are fixed/waiting/in progress
- What most frequent types of bugs reported are
- Which employee has fixed the most bugs
With this information, you know which aspect of your software needs improvement the most, as well as who from your team deserves praise and even a bonus.
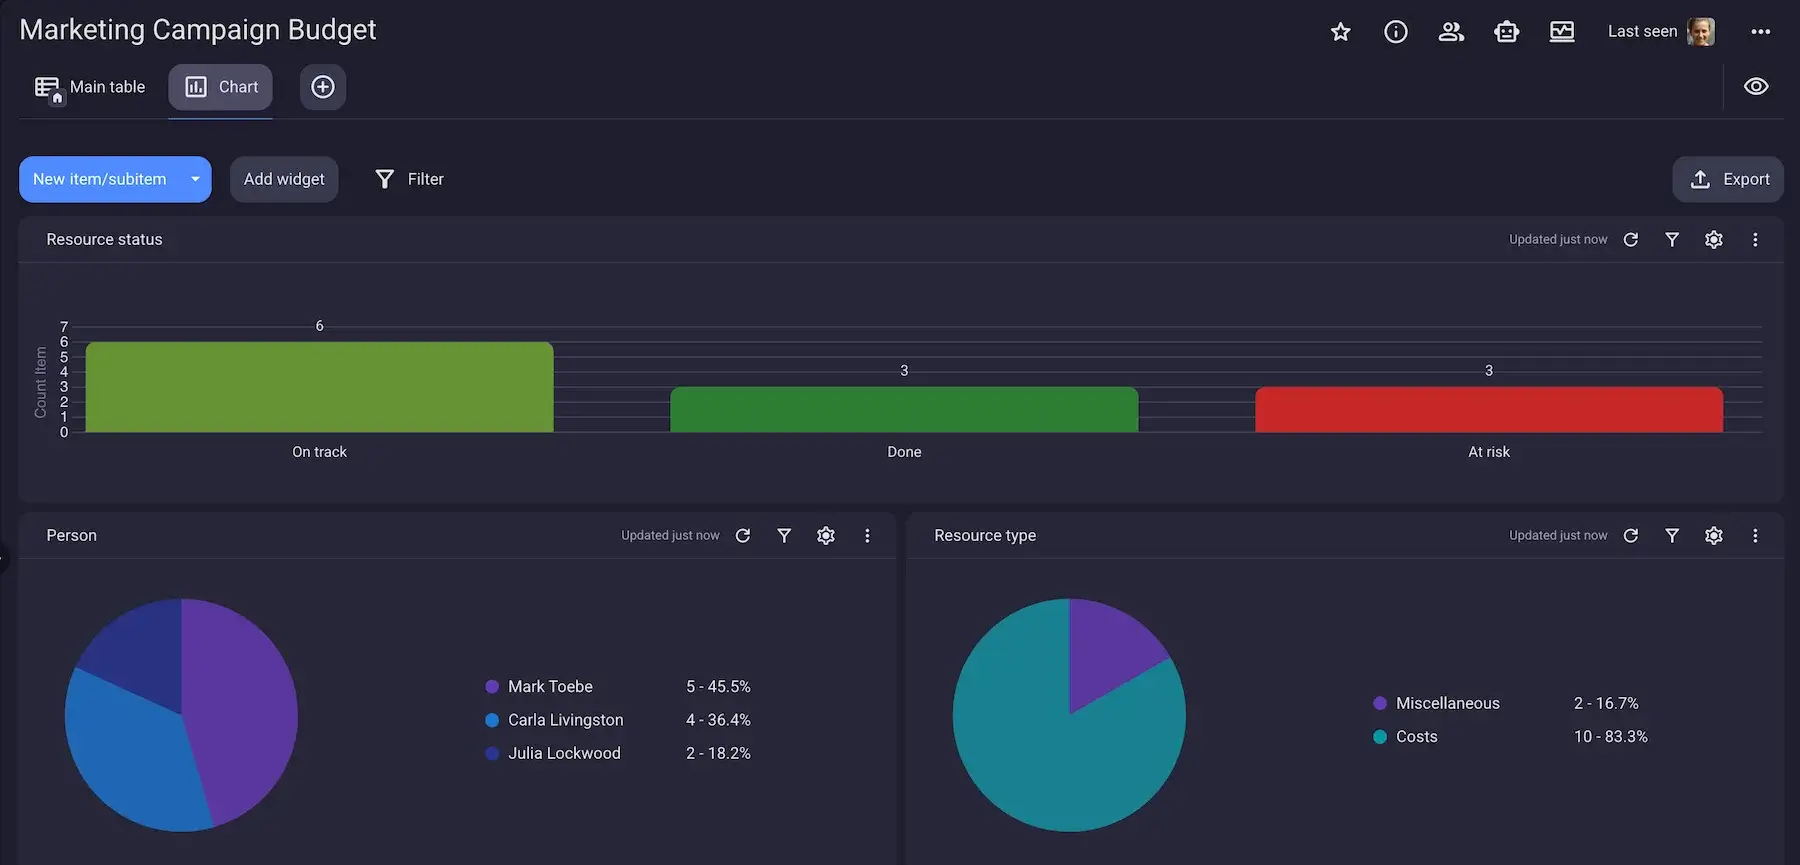
Also, no matter which industry you’re in, tracking your budget is always at the top of your list of priorities. With Chart view, you can see:
- Allocation of your budget across tasks
- The percentage of resources you’ve spent
- The highest spender in your team
And the best thing is that you can add several widgets (pie or bar charts) in Chart view to get a complete picture of your project’s statistics in one page.
Analyze project data in Chart view
💡 Dica profissional do Plaky
Manage resources even easier with Plaky’s resource planning templates:
Match the view to the goal
Here’s a table showing which view is the right one for you depending on what type of work you do and what your goals are.
| Goal | View | Why |
|---|---|---|
| I want to spot bottlenecks early on. | Kanban | Kanban gives you a clear overview of how many tasks there are in each stage of the project. |
| I want to track project statistics. | Chart view | Chart view centralizes data and shows it in percentages. |
| I need to see overlapping tasks. | Gantt view | Visual timelines in Gantt show you clearly when task timelines overlap and let you move tasks to rearrange them across the timeline. |
| I want to see all the information in one place. | Table view | Table view gives you a clear overview of all information neatly organized into fields. |
| I want to analyze trends in my project. | Chart view | Chart view enables you to track changes and see how your budget and resources are handled. |
| I need to keep an eye on task timelines. | Gantt chart | Gantt chart gives you a visual of your entire timeline and lets you adapt task timelines as you wish. |
Make any view sharper with sort, filter, and conditional coloring
Each of these 4 views can be customized to fit your specific project. Here’s how.
Sort and filter
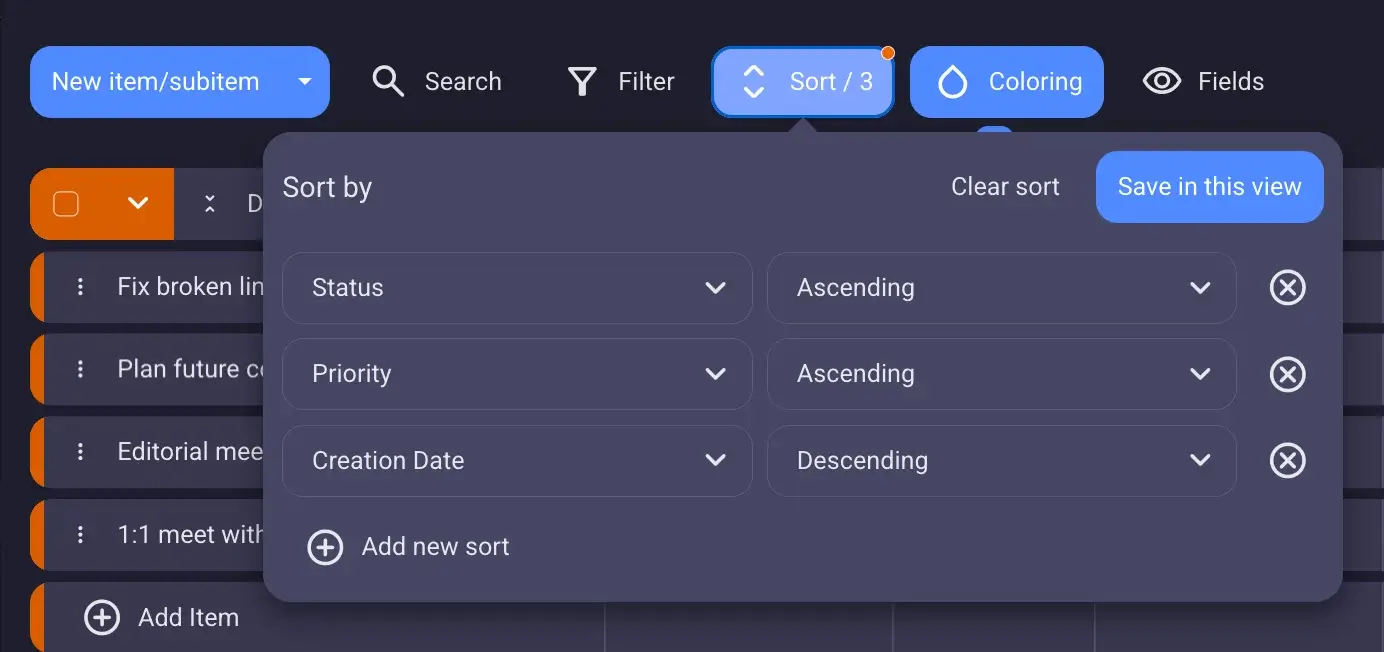
To further adapt your board views to match your workflows, you can sort and filter tasks in Plaky.
Sort your tasks according to priority, deadline, status, or any other field to push important tasks to the top of the list.
And, if you want to only see certain tasks, simply filter your board to find what you need. For example, you can filter tasks to see only high priority tasks, tasks due today, or only those that are in progress.
Conditional coloring
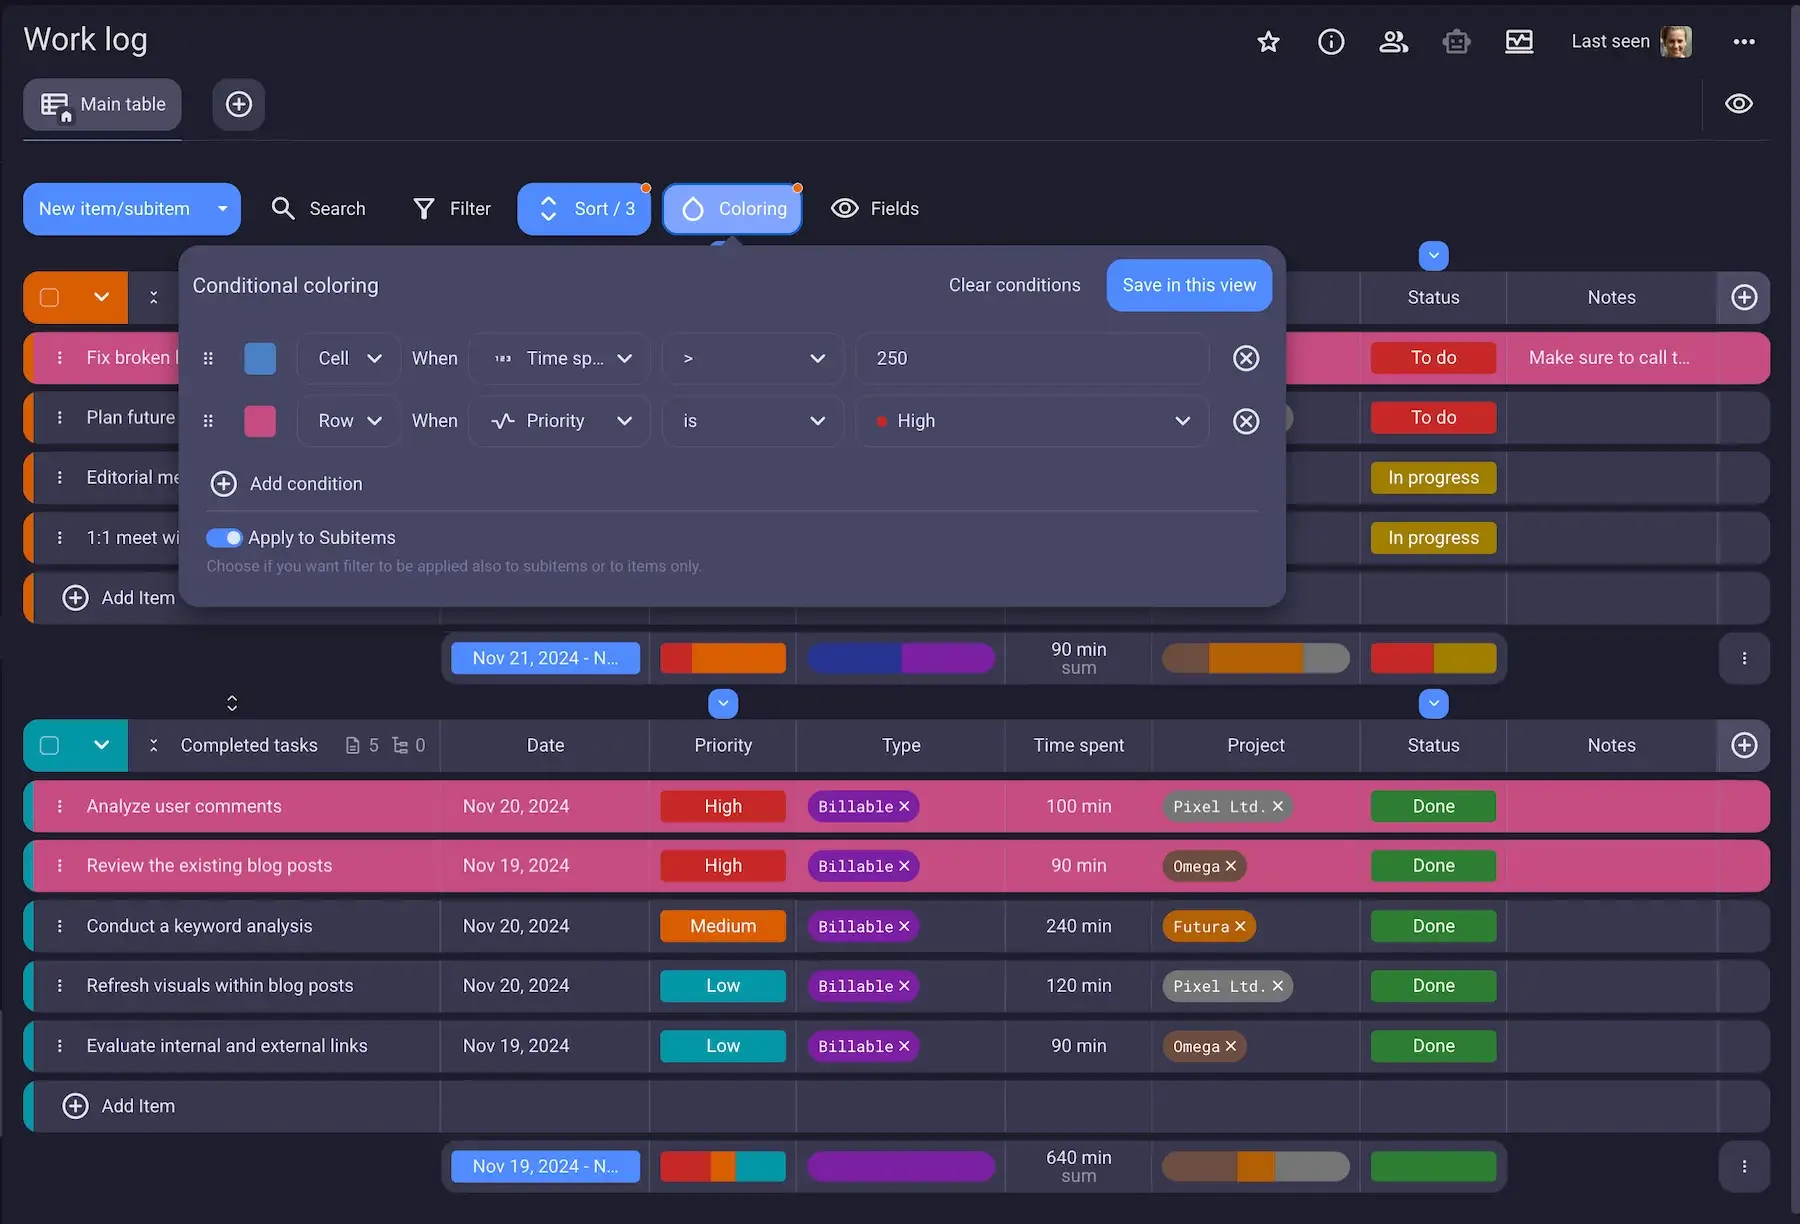
Conditional coloring brings your attention to tasks that require your immediate focus.
For example, if you often overlook tasks with an approaching deadline, you can set up your board to color the task red when the due date arrives.
Or, if you’re worried about high priority tasks, Plaky can color them so you never lose sight of them in the sea of other tasks.
Bonus: private views
If you want to view your board differently than other members of your team, you can add a new view and make it private only to you. There’s no limit — every board and all view types can be private.
This way, you can sort, filter, and regroup tasks as you see fit, without worrying you’ll disturb someone else. This is an excellent way to experiment without the fear you’ll mess up your board.
As a testimony to Plaky’s customizability, changing public views to private and vice versa is done in seconds so you can always adjust accessibility.
Start with one switch
Take a board you already have, open it in a new view, and see how that transforms how you see your project. Notice your focus change as you take in new aspects of the project that help you make smarter decisions.
Get an all-round approach to your project with Plaky’s multiple views.
Create a new board view in Plaky
Como revisamos esta publicação: Nossos redatores e editores monitoram as publicações e as atualizam quando novas informações são disponibilizadas, para mantê-las atualizadas e relevantes.